

present
Daftar dan dapatkan potongan bernilai $50 untuk pembelian pertama anda
Trading product for MyZtrade W1 MN zones Indikator EMA Supertrend, image 1
MyZtrade W1 MN zones
Indikator
Versi 1.0, Aug 2026
Windows, Mac
Trading product for MyZtrade W1 MN zones Indikator EMA Supertrend, image 2
Trading product for MyZtrade W1 MN zones Indikator EMA Supertrend, image 3
Trading product for MyZtrade W1 MN zones Indikator EMA Supertrend, image 4
Trading product for MyZtrade W1 MN zones Indikator EMA Supertrend, image 5
Sejak 28/06/2025

Penerangan

MyZtrade MTF ATR Zones — Multi-Timeframe ATR-Based Support & Resistance Zones

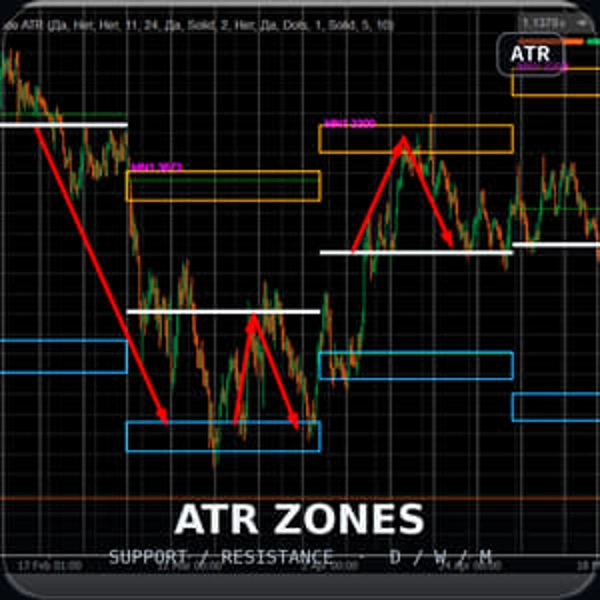
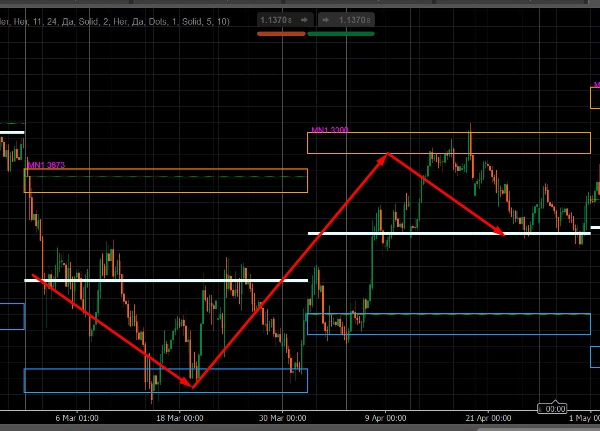
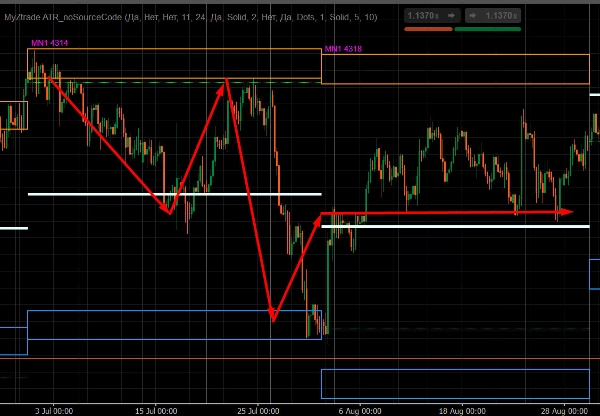
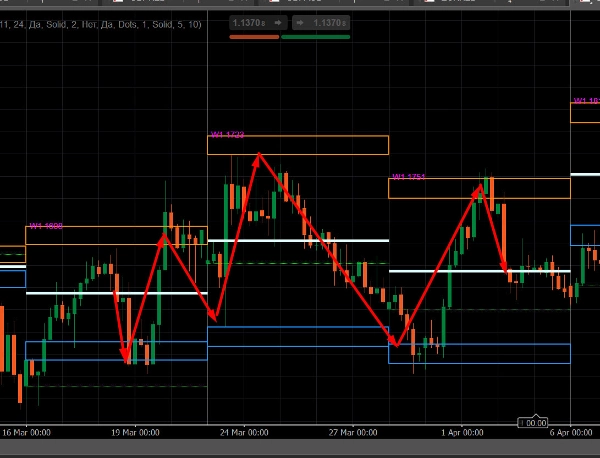
This indicator draws potential reversal zones (support/resistance) on the chart based on the average High–Low range of higher timeframe bars — Monthly, Weekly, and Daily — independent of the chart's own timeframe.


What It Does


For each enabled timeframe (Monthly / Weekly / Daily), the indicator:


• Calculates the average range (High–Low) over a specified number of the most recent bars in that timeframe (default: 11 bars)


• Plots rectangular resistance and support zones on the chart, offset from the high/low of each bar by the value of this average range


• Labels each zone with the volatility value in points and the timeframe prefix (for example, MN1 2696, W1 1180, D1 340) — useful when multiple timeframes are enabled simultaneously


• Additionally draws the bar's opening price line and the median line within the zone


• Separately tracks the current (not yet closed) bar — its zone moves in real time as the bar develops


Key Features


• Multiple timeframes simultaneously — Monthly, Weekly, and Daily can be enabled independently of one another


• Not tied to the chart's timeframe — you can view monthly zones on an hourly chart, etc.


• Fully customizable appearance — colors, line thickness and style, zone fill/outline, text size


• Serves as a visual guide; does not generate trading signals and does not contain entry/exit logic

Ringkasan

Ringkasan AI
MyZtrade W1 MN zones is a multi-timeframe indicator that identifies potential reversal zones of support and resistance on trading charts. It calculates the average range (High–Low) over a configurable number of recent bars (default 11) for selected higher timeframes—Monthly, Weekly, and Daily—regardless of the chart’s current timeframe. The indicator then plots rectangular zones offset from each bar’s high and low by this average range, visually marking areas where price reversals may occur.

Each zone is labeled with its volatility value in points and the corresponding timeframe prefix (e.g., MN1, W1, D1) to distinguish multiple enabled timeframes. Additional visual elements include the bar’s opening price line and a median line within each zone. The indicator also tracks the current, developing bar in real time, updating its zone dynamically.

Key features include simultaneous display of multiple timeframes, full customization of visual appearance (colors, line styles, text size), and independence from the chart’s timeframe, allowing monthly zones to be viewed on intraday charts. This tool serves as a visual guide for support and resistance levels based on volatility but does not provide trading signals or entry/exit logic.
Profil indikator

Ulasan pelanggan

0.0
Ulasan: 0
Ulasan pelanggan
Belum ada ulasan untuk produk ini. Anda sudah mencuba produk tersebut? Jadilah yang pertama untuk berkongsi pendapat anda!

Perbincangan

Soalan Lazim

EMA
Supertrend
Supply & Demand
ATR
Moving Average
VWAP
Support & Resistance
Produk yang tersedia melalui cTrader Store, termasuk bot dagangan, indikator dan plugin, disediakan oleh pembangun pihak ketiga dan diberikan akses untuk tujuan maklumat dan teknikal sahaja. cTrader Store bukan broker dan tidak memberikan nasihat pelaburan, syor peribadi atau sebarang jaminan prestasi masa hadapan.

Lebih banyak produk daripada penulis ini

Indikator
Volume
Key Levels
+4
Margin Zones its CME-based support/resistance levels from price extremes, helps traders spot entries and exits NKZ zones
Indikator
Channel
Fibonacci
+5
Market maker levels from key price extremes — catch major reversals and corrections in one click. ver1.2
Indikator
BOS
CHOCH
+5
MyZTrade High TF candle is a multi-timeframe visualisation tool that overlays completed higher-timeframe candles.

Anda juga mungkin suka

Indikator
AI
ATR
+27
Nadaraya-Watson Envelope Indicator
Indikator
Prop
Forex
+5
Transform your approach to trading with our innovative Pivot Point Indicator.
Indikator
Forex
The cTrader Market Sessions Alerts Indicator marks global sessions, highlights key levels, and sends real-time alerts.
Indikator
Prop
Forex
+11
Market Structure Shift – Professional Market Structure Oscillator
Indikator
ATR
Channel
Reversal Trap Probability Bands plots a dynamic volatility envelope around price & automatically detects "trap" reversal
Indikator
Prop
Forex
+5
Higher TimeFrame Candle Tracker: Current Timeframe (Any TimeFrame) Show High TimeFrame Candle Bar
Indikator
AI
SMC
+17
Smart Support/Resistance lines auto calculated from D1/H4/H1/M15. Highly customizable visuals + built in Backtest Mode.
Indikator
Forex
Real-Time Candlestick Pattern Detection with Custom Alerts & Trend Analysis for cTrader
Indikator
Forex
Crypto
+4
Pro Heikin Ashi Visual Overlay – Clean Trend Visualization
Indikator
ATR
Forex
+11
Elliott Wave 2 indicator with Markov probability analysis and a confidence score to assess Wave 3 continuation quality.
Indikator
Key Levels
Support & Resistance
Clean psychological round-number grid with native pip and point auto-scaling across Forex, Gold, Indices, and Crypto.
Indikator
Prop
Forex
+4
Automatic Support/Resistance zones from swing points.
Indikator
RSI
Breakout
+1
Dynamically adjusts regression channels based on ZigZag extremes, resetting when price breaks bands to track real trends
Indikator
Volume
Key Levels
+2
Support and resistance from a rolling volume profile, ranked by strength or recency, updated live.
Indikator
The Advanced Volume Profile Indicator calculates POC, Median, and Mode, revealing key price levels for smarter trading.
Indikator
Master RSI reversals with Parabolic SAR precision! Get real-time alerts for high-probability trend changes.
Indikator
ATR
RSI
+16
This trading game allows you to explore and practice investment strategies in a real-time market data environment.
Indikator
Forex
BTCUSD
+11
Visualize trends with Standard Deviation Channel! Display median, and add customizable upper/lower deviation channels.

Harga

Sejak 28/06/2025



















