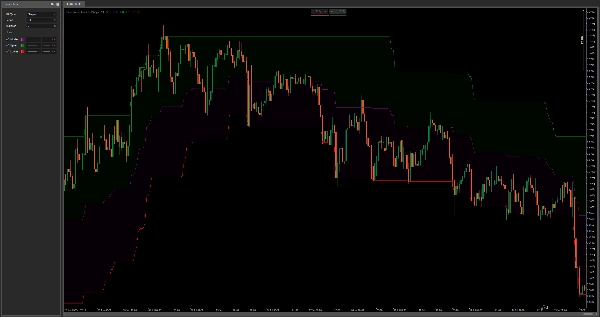
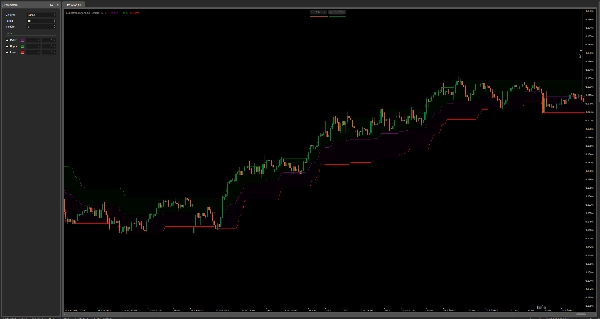
중개인 및 프랍
비즈니스용
00
Days
:
00
Hours
:
00
Minutes
:
00
Seconds
SupertrendChannels
"SupertrendChannels" 로고
가입일 03/01/2025
거래량
638.03K
핍 수익
21.34K
판매
9
"SupertrendChannels" 업로드된 이미지"SupertrendChannels" 업로드된 이미지

Supertrend Channels is a custom overlay indicator designed to help traders visually identify dynamic support and resistance zones, entry signals, and trailing stop-loss levels using ATR-based logic.

The indicator plots three lines:

  • Upper Band (Green) – acts as a dynamic resistance or trailing stop-loss for long trades.
  • Lower Band (Red) – acts as dynamic support or trailing stop-loss for short trades.
  • Middle Line (Purple) – serves as a mean-reversion level or potential entry point.

It calculates bands using the Average True Range (ATR) multiplied by a user-defined factor (Multiplier) and adds/subtracts that from the high/low of the current candle. A smoothing method (selectable MA type) is applied to the ATR to adjust responsiveness.

How to Use:

  • Entry: Look for entries near the middle line during consolidations or after crossing signals.
  • Trailing Stop-Loss: Use upper/lower bands as dynamic exit zones to lock in profit as trends extend.
  • Support & Resistance: These bands act like adaptive zones that reflect recent volatility and help spot potential turning points.

Unlike standard Bollinger Bands, this approach anchors bands off price extremes plus volatility, not a moving average, making it more responsive in trending environments and more adaptable for discretionary or algorithmic trading.

0.0
리뷰: 0
고객 리뷰
이 상품에 대한 리뷰가 아직 없습니다. 이미 사용해 보셨나요? 다른 사람들에게 가장 먼저 소개해 주세요!
이 작성자의 상품 더 보기
SwingHighLow
Auto-detect swing highs/lows. Spot reversals, map structure, and filter noise with adjustable strength.
TrendMagicOptimized
Clean trend indicator using CCI & ATR. Highlights up/down trends with adaptive, no-repaint lines.
Fisher_m11
Fisher Transform with smoothing. Spot reversals and cycles with precision. Great for any market, any timeframe.
LaguerreRSI
Laguerre RSI: smoother, faster RSI with less noise. Great for spotting reversals and timing entries.
VixFix
A volatility spike detector based on Larry Williams’ VIX Fix. Highlights market fear moments with clear histogram signal
HTFBB
Plot higher-timeframe Bollinger Bands for clearer structure, pullback zones, and breakout signals—without switching char
IBSBot
Buy-only IBS bot for indices on Daily timeframe. Enters near lows, exits near highs. No noise, just clean reversion.
SupertrendHTF
Overlay higher-timeframe SuperTrend to filter noise, follow real trends, and avoid lower-timeframe whipsaws. As
좋아하실 만한 다른 항목
DMI 3 bar v2
Shows BUY & SELL signals for 3 & 4 BAR PATTERN (Morning star/ Evening star). It is adjustable and it will SHOW ARROWS.
지표
NAS100
NZDUSD
Breakout
+17
Deviation Indicator by PrimeQuant
True Deviation - Trade extremes and reversions with deviation channels, SMC swings, liquidity levels, and impulse bias.
지표
Grid
NAS100
NZDUSD
+19
Supertrend-algo
Algorithmic trend precision for cTrader.
지표
Breakout
Scalping
KAMAKeltner
KAMA Keltner – Adaptive Volatility Channel for Precision Trading
지표
NAS100
NZDUSD
Breakout
+11
Previous day Key Levels
Previous day key levels indicator
지표
Indices
E7 BlackScholes Model
Option pricing using the BlackScholes model and the Math.Numerics packages
지표
NAS100
NZDUSD
Breakout
+17
OHLC and SMC - Market Structure
Multi-TF OHLC, NY Midnight, ZigZag & Gann S/R—clean visuals for SMC, scalping, and intraday precision.
지표
VWAP
VWAP Tokyo Open
VWAP Set to Tokyo Open
지표
NAS100
NZDUSD
XAUUSD
+11
Session HighLow Pivot Points Indicator advanced version
Visualize global trading sessions with colored range boxes. Track New York, London, Tokyo, and Sydney sessions
Chart Overview
ChartOverview – The Comprehensive Market Snapshot
E7 Harmonic Structures Basic
E7 Harmonic Structures Basic.
지표
NAS100
NZDUSD
XAUUSD
+13
SupportResistance
Auto-detect support and resistance & trendlines, highlight pullbacks/BOS retests, and filter with candle confirmation.
지표
Stocks
Forex
Crypto
Trend Angle Indicator [Iridio Capital]
The Trend Angle Indicator provides a clear and intuitive way to visualize market trends.
지표
Scalping
Kaufman Adaptive MA with Trend Vision
Adaptive KAMA: fast in trend, slow in noise — with color-coded market state visualization.
지표
NAS100
NZDUSD
Breakout
+12
VolumeColorBar
Color Volume Bars – Visualize Market Strength Instantly
지표
Forex
EURUSD
GBPUSD
AlgoCorner McGinley Dynamic
Designed to follow price more naturally, adjusting automatically to market speed, to reduce lag and false signals.
지표
NAS100
RSI
NZDUSD
+14
VWARSI_noSourceCode
The Volume-Weighted Edge: Improved RSI that can actually read the market moves.
지표
Forex
Pair Strenght JPY
Pair Strenght JPY