
설명
cTrader용 스윙 고점/저점 지표
프로처럼 시장 구조를 매핑하세요.
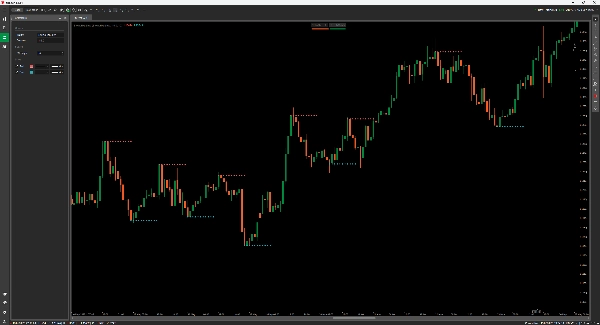
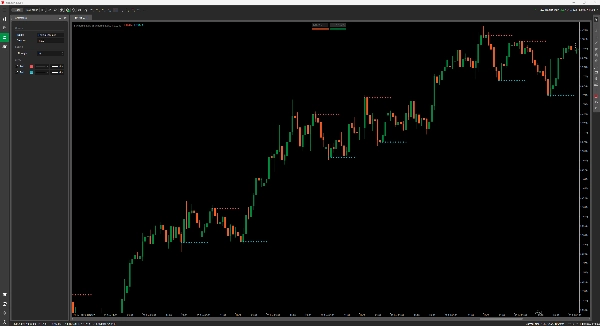
이 스윙 고점/저점 지표는 차트에서 중요한 전환점을 자동으로 감지하고 표시합니다—가격 움직임, 구조, 지지/저항 구역에 의존하는 트레이더에게 완벽합니다.
특징:
- 확인된 스윙 고점(빨강)과 스윙 저점(파랑)을 깔끔한 점 표시로 강조합니다.
- 조절 가능한 강도 매개변수로 노이즈를 걸러내거나 신호를 강화할 수 있습니다.
- 추세 분석, 반전 포착, 돌파 함정에 이상적입니다.
모든 타임프레임에서 작동합니다. 다시 그리지 않습니다. 단지 명확하게 표시된 견고한 시장 구조입니다.
요약
AI 요약
The SwingHighLow indicator for cTrader automatically detects and plots significant swing highs and lows on price charts, aiding traders in identifying market structure, price reversals, and support/resistance zones. It highlights confirmed swing highs in red and swing lows in blue with clear point markers. The indicator includes an adjustable strength parameter that allows users to filter market noise or tighten signal sensitivity according to their trading preferences. It is suitable for use across all timeframes and supports analysis for various markets including Forex, indices, commodities, stocks, and cryptocurrencies such as BTCUSD, EURUSD, and XAUUSD. The tool is designed to assist with trend analysis, spotting reversals, and identifying breakout traps without repainting, providing consistent and reliable market structure visualization.
지표 프로필
고객 리뷰
4.3
리뷰: 3
5 | 67 % | |
4 | 0 % | |
3 | 33 % | |
2 | 0 % | |
1 | 0 % |
고객 리뷰
July 22, 2025
Good support for rules for swing point analysis. it helps identify turning points and cleaner structure, especially when used for reviewing reversals, pullbacks and swing zones. Swing points look better after 3 pivots, especially when the 0.5 Fib area agrees with structure. The level is useful when it supports the market story.
July 21, 2025
July 21, 2025
Practical choice for demo for a more controlled workflow. It helps with reviewing reversals, pullbacks and swing zones, but the signal still needs broader context. Swing points look better after 3 pivots, especially when the 0.5 Fib area agrees with structure. I would still keep manual review in the process.
상담
자주 묻는 질문(FAQ)
BTCUSD
Forex
Signal
Breakout
Indices
EURUSD
Supertrend
Commodities
Stocks
XAUUSD
ATR
트레이딩 봇, 지표, 플러그인 등 cTrader Store에서 제공되는 상품은 제3자 개발자에 의해 제공되며, 이는 단순히 정보 및 기술적 접근을 목적으로 제공된 것입니다. cTrader Store는 중개인이 아니며, 투자 조언, 개인별 추천 또는 향후 성과에 대한 어떠한 보장도 제공하지 않습니다.


좋아하실 만한 다른 항목


가격
가입일 03/01/2025
638.03K
거래량
21.34K
핍 수익
15
판매