
설명
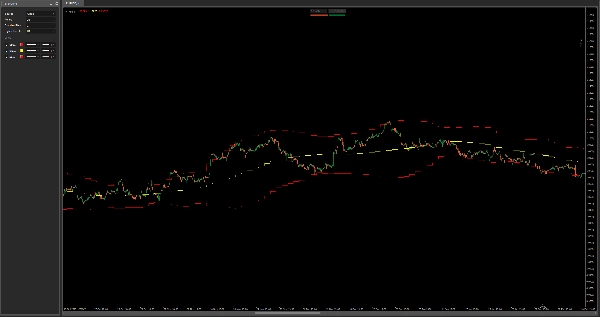
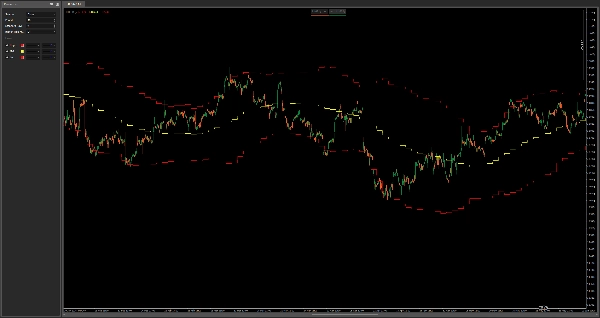
HTF 볼린저 밴드 – 다중 시간대 변동성 맵
이 지표는 상위 시간대의 볼린저 밴드를 현재 차트에 표시하여 변동성, 평균 회귀, 동적 지지/저항에 대한 강력한 컨텍스트를 제공합니다—시간대를 전환하지 않고도 말이죠.
특징:
- 선택 가능한 모든 상위 시간대의 상단, 중간, 하단 볼린저 밴드를 표시합니다
- HTF 통합 구역, 돌파 압력, 그리고 추세 되돌림을 파악하는 데 탁월합니다
- 상위 시간대 인식을 통해 스캘핑 및 당일 진입에 이상적입니다
- 모든 자산과 시간대에서 작동합니다
현재 전략과 결합하여 변동성 함정에 빠지는 것을 피하고 거시적 가격 구조와 일치하도록 유지하세요.
요약
지표 프로필
고객 리뷰
5.0
리뷰: 1
5 | 100 % | |
4 | 0 % | |
3 | 0 % | |
2 | 0 % | |
1 | 0 % |
고객 리뷰
July 29, 2025
confusing signals get easier to ignore, but a clean signal can still fail.
상담
자주 묻는 질문(FAQ)
트레이딩 봇, 지표, 플러그인 등 cTrader Store에서 제공되는 상품은 제3자 개발자에 의해 제공되며, 이는 단순히 정보 및 기술적 접근을 목적으로 제공된 것입니다. cTrader Store는 중개인이 아니며, 투자 조언, 개인별 추천 또는 향후 성과에 대한 어떠한 보장도 제공하지 않습니다.


!["[CB] Pivot Points Pro" 로고](https://cdn.ctrader.com/image/webp/43463c82-67b0-4f10-a4ba-901bba091d81_32594)

가격
가입일 03/01/2025
638.03K
거래량
21.34K
핍 수익
15
판매