
설명
개요
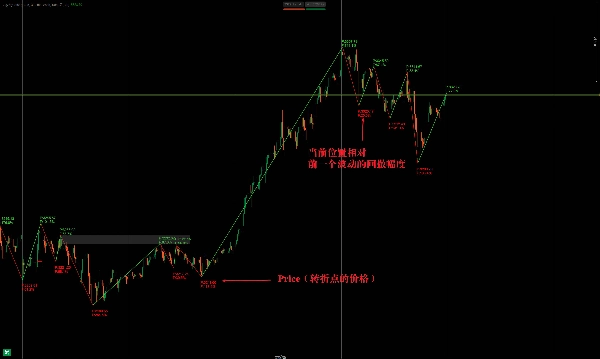
ZigZag 지표는 주로 시장 소음을 걸러내어 주요 가격 반전 지점을 식별하는 데 사용되는 기술적 분석 도구입니다. 중요한 고점과 저점을 ZigZag 선으로 연결하여 트레이더가 추세와 잠재적 돌파구를 시각화하는 데 도움을 줍니다.
ZigZag 작동 원리
- 핵심 기능
-
- 최소 가격 변동 임계값(백분율 또는 고정 값)을 설정하여 작은 가격 변동을 제거합니다.
- 의미 있는 스윙 고점/저점만 연결하여 추세 분석을 단순화합니다.
- 주로 지지/저항 수준, 반전 (예: 헤드 앤 숄더, 이중 천장/바닥)을 감지하는 데 사용됩니다.
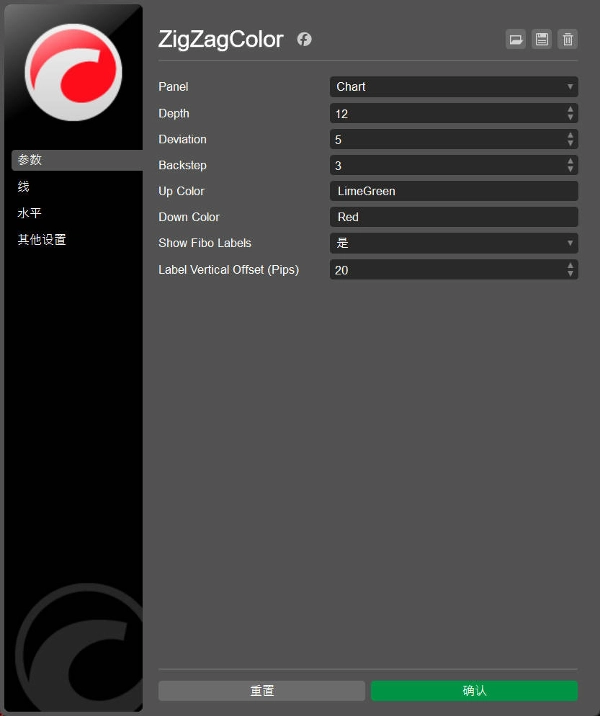
- 주요 매개변수
-
- 최소 가격 변동 (%): 민감도를 결정합니다 (예: 5%는 이보다 작은 움직임을 무시).
- 과거 분석 깊이: 분석할 과거 캔들 수를 제어하며 지연에 영향을 미칩니다.
주요 활용
1. 추세 식별
- 상승 추세: 더 높은 고점(HH) + 더 높은 저점(HL).
- 하락 추세: 더 낮은 고점(LH) + 더 낮은 저점(LL).
- 잠재적 돌파 거래를 위한 추세선을 그리는 데 도움을 줍니다.
2. 패턴 인식
- 스윙 포인트를 정의하여 고전적인 차트 패턴(삼각형, 깃발, 쐐기)을 드러냅니다.
3. 피보나치 되돌림 수준
- 피보나치 확장 또는 되돌림을 위한 명확한 스윙 고점/저점을 표시합니다.
4. 다이버전스 탐지
- 가격과 오실레이터(RSI, MACD) 간의 다이버전스를 강조합니다.
ZigZag 指标是一种用于技术分析的工具,主要用于识别价格趋势中的关键转折点,帮助交易者过滤市场噪音,突出重要的高点和低点。以下是其核心要点及用法:
ZigZag 指标的原理
- 基本功能:
-
- 通过设定价格波动的阈值(百分比或固定值),自动忽略小幅波动,仅连接显著的高点和低点,形成折线(ZigZag 形态)。
- 常用于辅助识别支撑/阻力位、趋势反转(如头肩顶、双底等形态)。
- 核心参数:
-
- 最小波动幅度(如5%或点数):决定过滤小波动的灵敏度。值越大,信号越少但更可靠。
- 回溯深度:控制计算时参考的K线数量,影响转折点的延迟性。
主要用途
- 趋势识别:
-
- 通过连续的高点抬高(上升趋势)或低点降低(下降趋势)判断趋势方向。
- 结合趋势线,可提前预判突破或回调。
- 形态分析:
-
- 识别经典价格形态(如三角形、旗形),ZigZag 线条能清晰显示形态边界。
- 斐波那契工具配合:
-
- 用ZipZag标记的波段高/低点,作为斐波那契回撤或扩展的起点/终点。
- 背离检测:
-
- 价格与指标(如RSI、MACD)出现背离时,ZipZag帮助确认背离段的起点和终点。
요약
지표 프로필
고객 리뷰
0.0
리뷰: 0
고객 리뷰
이 상품에 대한 리뷰가 아직 없습니다. 이미 사용해 보셨나요? 다른 사람들에게 가장 먼저 소개해 주세요!
상담
자주 묻는 질문(FAQ)
Prop
Forex
Breakout
Indices
Commodities
RSI
Crypto
Stocks
MACD
트레이딩 봇, 지표, 플러그인 등 cTrader Store에서 제공되는 상품은 제3자 개발자에 의해 제공되며, 이는 단순히 정보 및 기술적 접근을 목적으로 제공된 것입니다. cTrader Store는 중개인이 아니며, 투자 조언, 개인별 추천 또는 향후 성과에 대한 어떠한 보장도 제공하지 않습니다.


!["[Hamster-Coder] Pivot Points MTF" 로고](https://cdn.ctrader.com/image/webp/4c143e5a-309c-40e3-a578-f04d1e133ffa_31159)


가격
가입일 30/09/2024
44
판매