
Break of Structure
지표
3 구매
버전 1.0, Aug 2025
Windows, Mac
5.0
리뷰: 2
설명
The Break of Structure (BoS CHoCH) Indicator는 트레이더가 추세 지속과 추세 반전을 실시간으로 쉽게 포착할 수 있도록 설계된 스마트 시장 구조 도구입니다. 스윙 고점과 저점을 자동으로 감지하여 이 도구는 Break of Structure (BoS)와 Change of Character (ChoCh) 지점을 식별하며, 차트에 직접 시각적 표시기로 명확하고 실행 가능한 거래 신호를 제공합니다.
🔎 작동 원리
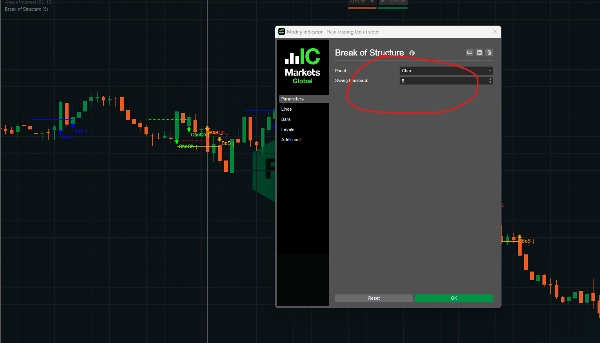
- 스윙 고점/저점을 감지하기 위해 회고 기간을 사용합니다.
- BoS와 ChoCh는 현재 가격과 이전 구조 지점을 비교하여 감지됩니다.
- 가격이 이전 LH 또는 HL을 돌파할 때 ChoCh가 확인되면 거래 신호가 발생합니다.
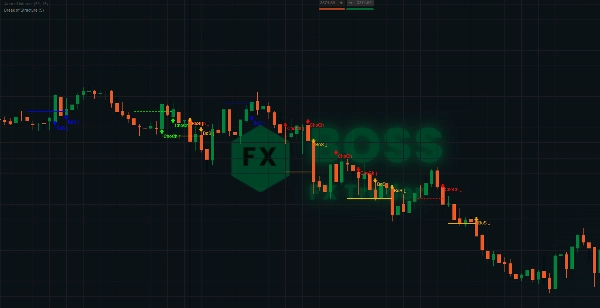
- Break of Structure (BoS): 라벨과 화살표로 표시됩니다 (추세 지속).
- Change of Character (ChoCh): 다른 라벨과 화살표로 표시됩니다 (추세 반전).
- 스윙 고점/저점 감지는 구조 지점을 동적으로 추적 및 업데이트하는 데 사용됩니다.
⚡ 지표 특징
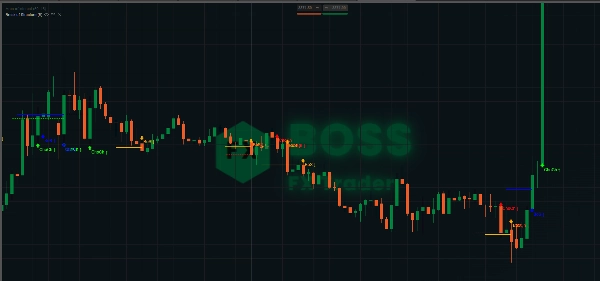
- ✅ BoS 감지: 가격이 최근의 높은 고점(HH) 또는 낮은 저점(LL)을 돌파할 때 표시합니다.
- ✅ ChoCh 감지: 가격이 낮은 고점(LH) 또는 높은 저점(HL)을 돌파할 때 표시합니다.
- ✅ 시각적 라벨 및 화살표: 차트에 직접 표시되는 읽기 쉬운 신호입니다.
- ✅ 추세 추적: 시장 구조 변화 식별을 단순화합니다.
The BoS Indicator by BossFXTrader는 트레이더에게 가격 움직임을 이해하는 데 시각적 우위를 제공합니다. 추세 지속이든 반전이든, 이 도구는 시장 구조의 중요한 순간을 강조하여 자신 있게 거래에 진입할 수 있도록 도와줍니다.
요약
AI 요약
The Break of Structure (BoS CHoCH) Indicator is a market structure analysis tool that helps traders identify trend continuations and reversals in real time. It automatically detects swing highs and lows using a configurable lookback period to track and update key structure points dynamically. The indicator marks Break of Structure (BoS) events—when price breaks recent higher highs or lower lows—signaling trend continuation, and Change of Character (ChoCh) events—when price breaks prior lower highs or higher lows—indicating potential trend reversals. Visual labels and arrows are plotted directly on the chart to clearly highlight these critical moments, aiding traders in recognizing shifts in market structure. This tool supports price action analysis by providing actionable trade signals through its dynamic detection of market swings and structure breaks.
지표 프로필
고객 리뷰
5.0
리뷰: 2
5 | 100 % | |
4 | 0 % | |
3 | 0 % | |
2 | 0 % | |
1 | 0 % |
고객 리뷰
September 5, 2025
September 2, 2025
demo first, then maybe small size if the notes look sane. It should stay in the support stack.
상담
자주 묻는 질문(FAQ)
트레이딩 봇, 지표, 플러그인 등 cTrader Store에서 제공되는 상품은 제3자 개발자에 의해 제공되며, 이는 단순히 정보 및 기술적 접근을 목적으로 제공된 것입니다. cTrader Store는 중개인이 아니며, 투자 조언, 개인별 추천 또는 향후 성과에 대한 어떠한 보장도 제공하지 않습니다.
이 작성자의 상품 더 보기


좋아하실 만한 다른 항목


가격
가입일 29/05/2025
3.03M
거래량
45.22K
핍 수익
28
판매
749
무료 설치