
설명
공정 가치 격차 지표
개요
공정 가치 격차 지표는 단기 시장 불균형을 식별, 추적 및 검증하려는 가격 행동 트레이더를 위한 정밀 도구입니다. 이 지표는 강세 및 약세 공정 가치 격차(FVG)를 자동으로 감지하고, 차트에서 활성(완화되지 않은) 영역을 강조 표시하며, 가격이 나중에 해당 영역을 채우는(완화하는) 시점을 기록합니다. 가볍고 재도색되지 않으며(닫힌 바에서 작동), 라이브 거래 및 백테스팅에서 신뢰할 수 있는 분석을 위해 설계되었습니다.
주요 특징
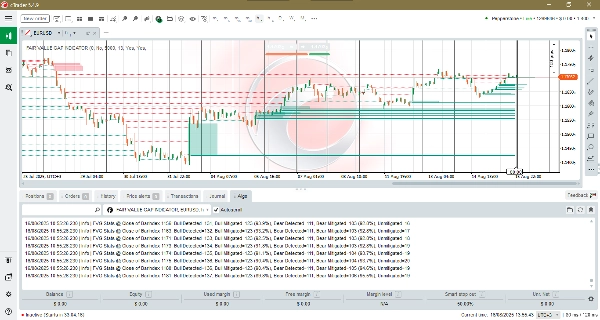
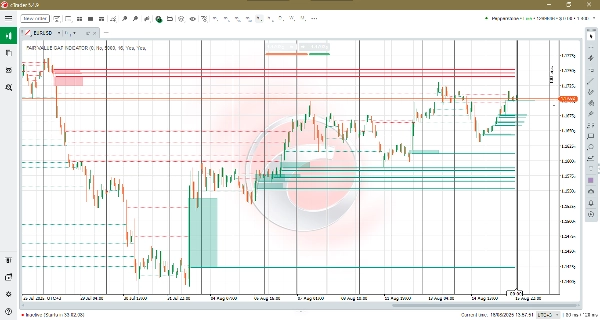
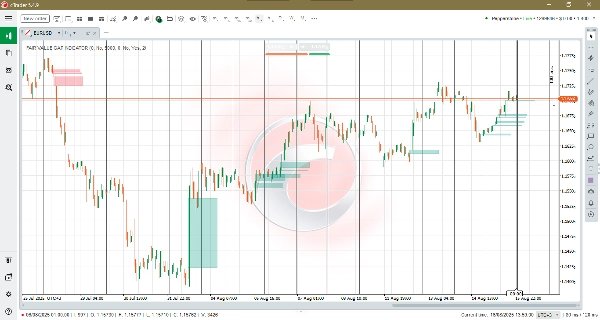
- 자동 FVG 감지: 견고한 3바 논리가 강세 및 약세 불균형 영역을 모두 식별하고 차트에 깔끔한 직사각형 영역을 표시합니다.
- 완화 추적: 가격이 영역을 통과하여 마감하면 지표가 박스를 제거하고 과거 참조를 위해 지속적인 점선 완화선을 그릴 수 있습니다.
- 완화되지 않은 수준 오버레이: 감지된 바에서 현재 형성 중인 바로 그려진 굵은 수평선으로 최근 N개의 채워지지 않은 수준을 표시합니다. 이를 통해 활성(완화되지 않은) 공정 가치 격차를 시각적으로 쉽게 스캔하고 가격 수준을 빠르게 식별할 수 있습니다.
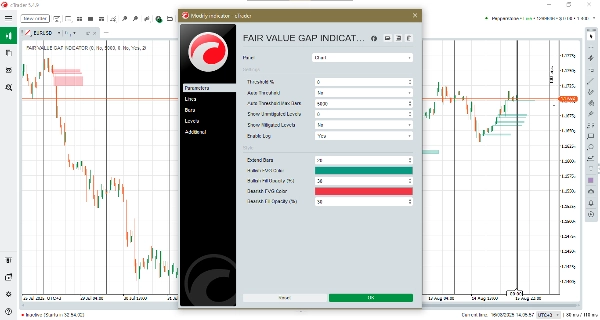
- 수동 및 자동 임계값 설정: 고정 상대 임계값을 선택하거나 자동 임계값을 활성화하여 지표가 최근 시장 활동에 적응하도록 할 수 있습니다.
- 자동 임계값 최대 바: 자동 임계값을 계산하는 데 사용되는 슬라이딩 윈도우 크기를 제어합니다. 값이 클수록 임계값이 더 부드럽고(더 긴 역사에 걸쳐 안정적), 값이 작을수록 최근 변동성에 더 민감하게 반응합니다.
- 사용자 지정 시각 효과 및 투영: 강세 및 약세 영역의 확장 길이(박스가 투영되는 거리), 색상 및 채우기 불투명도를 설정하여 차트 스타일에 맞출 수 있습니다.
- 터미널 로깅: 감지된 총 FVG, 완화 및 현재 완화되지 않은 수를 보고하는 간결한 로그 라인으로 신호 검증 및 전략 조정에 이상적입니다.
- 닫힌 바 논리: 재도색을 최소화하기 위해 닫힌 바마다 한 번 실행되도록 설계되었습니다.
장점
- 명확한 거래 참조: 반환 목표, 반응 영역 또는 거래 관리 참조로 작용할 수 있는 불균형 영역을 빠르게 찾을 수 있습니다.
- 검증 및 통계: 터미널 로그와 완화 비율을 사용하여 신호를 검증하고 전략의 민감도를 조정할 수 있습니다.
- 적응형 민감도: 자동 임계값 + 최대 바 기능으로 조용한 시장과 변동성이 큰 시장 모두에서 지속적인 수동 재조정 없이 신뢰성 있게 작동합니다.
- 간결하고 비침해적인 시각 효과: 최소한의 시각적 공간을 차지하여 차트를 읽기 쉽게 유지하면서 필수 컨텍스트를 보존합니다.
적합 대상
가격 행동과 불균형 개념에 의존하는 데이 트레이더, 스윙 트레이더 및 스캘퍼, 그리고 주문 흐름 반응과 전략 성과를 검증하는 분석가에게 적합합니다.
결론
공정 가치 격차 지표는 정밀한 불균형 감지, 완화 분석 및 적응형 임계값 설정을 결합하여 시장 불균형에 대한 집중적이고 저잡음의 시각을 제공합니다. 이를 사용하여 잠재적인 가격 반등을 포착하고, 거래를 보다 지능적으로 관리하며, 시장에서 영역이 얼마나 자주 채워지는지 측정할 수 있습니다.
요약
AI 요약
The Fair Value Gap (FVG) Indicator is a technical analysis tool designed for price-action traders to identify and monitor short-term market imbalances. It automatically detects bullish and bearish Fair Value Gaps using a robust 3-bar logic and visually highlights active (unmitigated) zones on trading charts. The indicator tracks when these zones are later filled (mitigated) by price action, removing the zone highlight and optionally drawing a persistent dotted line for historical reference.
Key features include automated FVG detection, mitigation tracking, and an overlay showing recent unmitigated levels as bold horizontal lines for easy visual scanning. Users can select manual or automatic thresholding to adapt sensitivity to market conditions, with adjustable parameters controlling the responsiveness of the auto threshold. Customizable visual settings allow traders to tailor the appearance of bullish and bearish zones.
The indicator operates on closed bars to minimize repainting, ensuring reliable signals for live trading and backtesting. Terminal logging provides concise statistics on detected gaps and mitigations, aiding validation and strategy tuning.
Suitable for day traders, swing traders, scalpers, and analysts, the Fair Value Gap Indicator supports markets including Forex, indices, commodities, cryptocurrencies, and stocks. It offers a focused, low-noise view of market imbalances to assist in identifying potential price return targets and managing trades.
지표 프로필
고객 리뷰
5.0
리뷰: 2
5 | 100 % | |
4 | 0 % | |
3 | 0 % | |
2 | 0 % | |
1 | 0 % |
고객 리뷰
상담
자주 묻는 질문(FAQ)
Forex
Indices
Commodities
Fair Value Gap
SMC
Crypto
Stocks
트레이딩 봇, 지표, 플러그인 등 cTrader Store에서 제공되는 상품은 제3자 개발자에 의해 제공되며, 이는 단순히 정보 및 기술적 접근을 목적으로 제공된 것입니다. cTrader Store는 중개인이 아니며, 투자 조언, 개인별 추천 또는 향후 성과에 대한 어떠한 보장도 제공하지 않습니다.


가격
가입일 14/06/2025
1
판매