
説明
🌐 機関投資家のフロー読み取りで市場を支配する
何を示すか:実際に成立した取引 — 真の攻撃的フロー。
利点:このインジケーターはティックデータで表されます。
すでに市場にコミットされた資金を表します。
攻撃者を分類します(買い手/売り手がアスク/ビッドにヒット)。
吸収、疲弊、フローの加速を検出します。
📈 無料インジケーター、価格ごとのボリューム、ボリュームスクイーザーと組み合わせてください。
https://ctrader.com/products/2514 https://ctrader.com/products/2874
オーダーフロー
テープリーディング
ラダーDOM
機関投資家の吸収
インテリジェントブレイクアウト
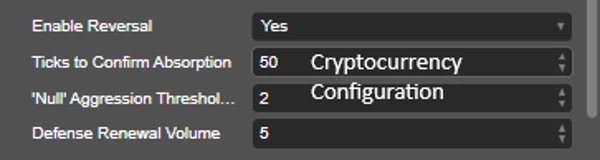
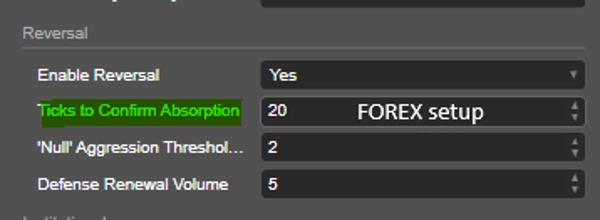
フローの反転
買いと売りの圧力
リアルタイムの攻撃分析
このシステムは従来のチャートを真の機関市場読み取りハブに変換します。
アルゴリズムの差別化ポイント
一般的なインジケーターがローソク足のみを分析するのに対し、テープリーディングスキャルパーは以下を解釈します:
✅ 買い手と売り手からの真の攻撃性
✅ フローの速度
✅ 機関投資家の防御
✅ オーダーの吸収
✅ ラダーの加速
✅ フローによって確認されたブレイクアウト
✅ 疲弊による反転
✅ 機関投資家対個人投資家の圧力
✅ インテリジェントなロットスケーリング
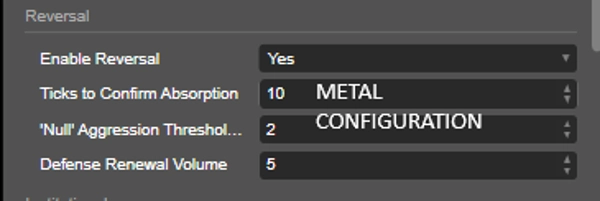
システム構造
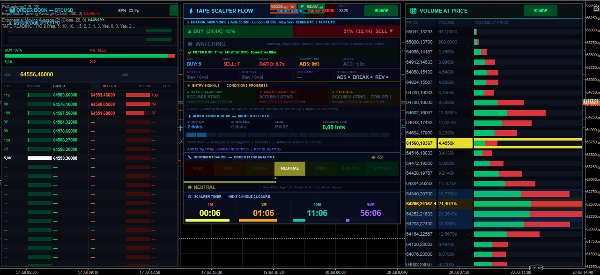
アルゴリズムは2つの独立したプロフェッショナルパネルを持っています:
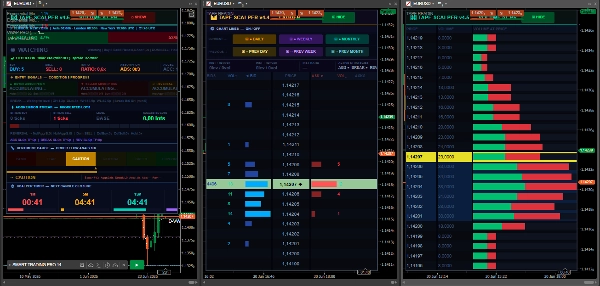
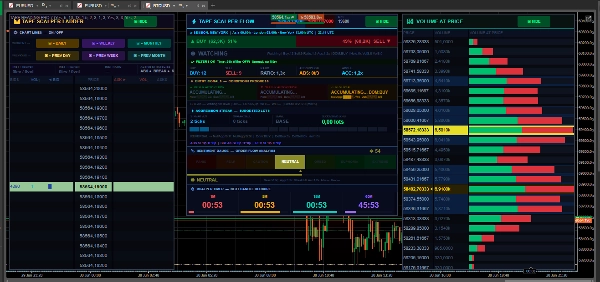
⚡ フローパネル(ウィンドウ1)
操作的な読み取りとシグナル生成を担当するパネル。
表示内容:
買い手/売り手のフロー
吸収
反転
ブレイクアウト
攻撃の連続
市場セッション
買い/売り比率
ラダーの加速
動的SL/TP
操作フィルター
📊 ラダーパネル(ウィンドウ2)
機関投資家向けパネルで、以下に焦点を当てています:
DOMラダー
機関レベル
価格ごとのボリューム
機関の圧力
POC
レンジ
日次および週次の高値/安値
プライスブック
機関の熱量
ラダー機能の説明
1. 買いの攻撃性
現在の買い手の攻撃性を示します。
急激に増加すると:
買い手が強く参入しています。市場は上昇加速する可能性があります。ブレイクアウトの可能性を示します。
数値が高いほど:
➡ より強い買い圧力。
2. 売りの攻撃性
売り手の攻撃性を示します。
急激に増加すると:
売り手が支配しています
下落の継続の可能性
機関のショートエントリー
3. 買い/売り比率
買い手と売り手の関係を示します。
例:
比率 2.0x = 買い手が優勢
比率 3.0x = 強い機関圧力
比率が1.0未満 = 売り手が優勢
解釈:
比率の解釈
1.0 均衡
1.5 中程度の圧力
2.0以上 強いトレンド
3.0以上 強い機関フロー
4. 吸収
アルゴリズムの最も強力な機能の一つ。
システムは以下を検出します:
大量の攻撃的なボリュームがあるが
価格が動いていない
これは意味します:
➡ 機関投資家がオーダーを吸収している。
買い手の吸収
市場は多くの売りを受けていますが:
価格は下落を止めます。機関の防御が現れます。買いへの反転の可能性。
シグナル:
▲ 買い手の吸収
売り手の吸収
市場は多くの買いを受けていますが:
価格は上昇しません。売り手が動きを抑えています。売りへの反転の可能性。
シグナル:
▼ 売り手の吸収
5. ラダーの加速
DOM内のフローの速度を測定します。
アルゴリズムは以下を比較します:
最近のフロー
対 前のフロー
加速すると:
➡ おそらく機関の参入。
例:
値 意味
1.0x 通常のフロー
1.5x 強い加速
2.0x+ 機関の爆発的増加
6. ブレイクアウト検出
真のブレイクアウトを検出します。
システムは以下を検証します:
✅ ボリューム
✅ 攻撃性
✅ 速度
✅ 連続性
✅ 機関フロー
✅ ラダーの加速
ブレイクアウト買い
条件:
強い買いの攻撃性 ラダーの加速 機関の圧力 高値のブレイクアウト
結果:
➡ 検証された買いエントリー。
ブレイクアウト売り
条件:
強い売り圧力 売りの機関フロー サポートのブレイクアウト
結果:
➡ 売りが確認されました。
7. 反転検出
疲弊による反転を検出します。
システムは以下を識別します:
攻撃性の消失 機関の防御の出現 トレンドの強さの喪失
結果:
➡ 予想される反転。
8. 連続システム
インテリジェントなフロー連続性システム。
何回連続してティックが発生したかをカウントします:
連続買い
または
連続売り
連続レベル
レベル 意味
レベル1 初期トレンド
レベル2 強いフロー
レベル3 爆発的な動き
9. 推奨ロット数
アルゴリズムは自動的に提案します:
ロットサイズの増加
リスクの軽減
操作スケール
基づくもの:
✅ フローの強さ
✅ 連続性
✅ 機関の強度
11. POC(コントロールポイント)
最も取引量の多い価格を示します。
重要性:
強力なサポート/レジスタンス
機関ゾーン
防御領域
12. 日次/週次レベル
自動ライン:
日次高値
日次安値
週次高値
週次安値
使用目的:
✅ ブレイクアウト
✅ 反転
✅ 流動性
✅ ストップロス注文
13. 機関フィルター
高度な機関フィルター。
違い:
個人投資家のフロー
対 機関投資家のフロー
システムは以下を検証します:
✅ 機関クラスター
✅ レベルごとのボリューム
✅ 支配的な圧力
📈 このインジケーターを戦略へのエントリーの確認として使用してください。フロー、吸収シグナル、テープの速度、ティックの攻撃性、そしてセンチメントの分析の重要性を強調する価値があります。
概要
Key functionalities include detection of institutional absorption (when large volume does not move price), breakout validation through volume and flow speed, reversal anticipation by exhaustion signals, and an intelligent streak system counting consecutive buy or sell ticks. The indicator also suggests lot sizing based on flow strength and institutional intensity, and applies an institutional filter distinguishing retail versus institutional flow.
Tape Reading 4.2 supports analysis of key market levels, real-time aggression, and flow reversals, transforming traditional charts into comprehensive institutional market reading tools. It is suitable for traders seeking detailed order flow insights and confirmation signals for entries based on market microstructure and volume dynamics.
カスタマーレビュー
5 | 50 % | |
4 | 50 % | |
3 | 0 % | |
2 | 0 % | |
1 | 0 % |


