
Opis
Uzupełnij swoje strategie tym wskaźnikiem sygnałowym👇🏻
https://ctrader.com/pt/products/1560?u=Goulart
✔Funkcje wskaźnika
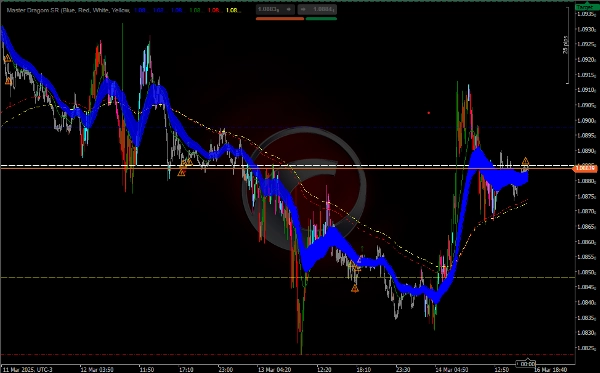
Wsparcie i opór (SR):
Wskaźnik rysuje poziome linie dla dziennych, tygodniowych i miesięcznych poziomów wsparcia i oporu.
Możesz włączyć lub wyłączyć każdy poziom (otwarcie, zamknięcie, maksimum i minimum) według potrzeb.
Wykładnicze średnie kroczące (EMA):
Wskaźnik oblicza wiele EMA (50, 25, 200 i 233 okresy), aby pomóc w identyfikacji trendów i potencjalnych dynamicznych obszarów wsparcia/oporu.
EMA są wyświetlane na wykresie w różnych kolorach dla łatwiejszego oglądania.
Analiza wolumenu (PVAVolumeAnalysis):
Wskaźnik analizuje wolumen, aby zidentyfikować potencjalne odwrócenia lub kontynuacje trendu.
Wyróżnia słupki z powyżej średniej wolumenem i sygnalizuje znaczące zmiany wolumenu ikonami (↑, ↓, ⚠️).
Kolorowanie słupków:
Słupki są kolorowane na podstawie wolumenu i kierunku ceny (w górę lub w dół), co pomaga zidentyfikować siłę trendu.
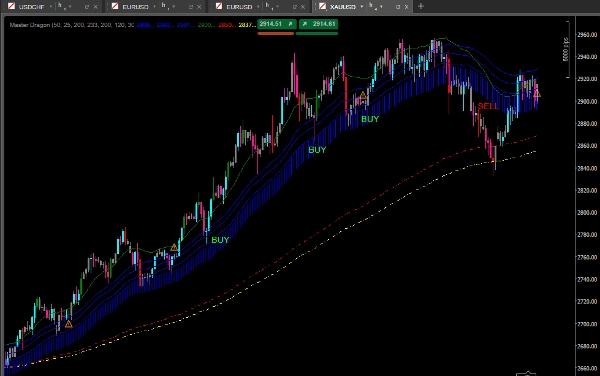
Analiza trendu za pomocą EMA:
Użyj EMA, aby określić kierunek trendu:
Jeśli cena jest powyżej EMA (szczególnie 200 i 233 EMA), trend jest wzrostowy.
Jeśli cena jest poniżej EMA, trend jest spadkowy.
Obszar między 50 EMA High i Low może być używany jako strefa zainteresowania dla potencjalnych odwróceń lub kontynuacji.
Analiza wolumenu:
Obserwuj ikony i kolory słupków, aby zidentyfikować zmiany wolumenu:
Wysoki wolumen przy rosnącej cenie (↑): Potwierdzenie trendu wzrostowego.
Wysoki wolumen przy spadającej cenie (↓): Potwierdzenie trendu spadkowego.
Niski wolumen przy rosnącej lub spadającej cenie (⚠️): Możliwe odwrócenie.
Łączenie sygnałów:
Łącz sygnały wolumenu, EMA i poziomów SR, aby podejmować decyzje o wejściu lub wyjściu.
Na przykład, jeśli cena jest blisko poziomu oporu, a wolumen maleje, może to być sygnał odwrócenia.
Sugerowana strategia
Strategia trendu z potwierdzeniem wolumenu
Określ trend:
Użyj EMA (200 i 233), aby określić główny trend.
Jeśli cena jest powyżej EMA, rozważ tylko kupno.
Jeśli cena jest poniżej EMA, rozważ tylko sprzedaż.
Czekaj na cofnięcie:
Czekaj, aż cena wróci do krótszego EMA (50 lub 25) lub do poziomu SR.
Potwierdź wolumenem:
Sprawdź, czy wolumen rośnie w kierunku trendu (↑ dla kupna, ↓ dla sprzedaży).
MA lokalizuje trendy, cofnięcia, sygnały wolumenu, odwrócenia, wsparcie i opór.
Jeśli wolumen maleje (⚠️), unikaj wejścia lub rozważ odwrócenie.
Wejście:
Kupuj, gdy cena jest powyżej EMA i blisko poziomu wsparcia, z wolumenem potwierdzającym trend wzrostowy.
Sprzedawaj, gdy cena jest poniżej EMA i blisko poziomu oporu, z wolumenem potwierdzającym trend spadkowy.
Wyjście:
Używaj poziomów SR lub EMA jako celów lub punktów wyjścia.
Na przykład zamknij lub sprzedaj, gdy osiągnie poziom wsparcia.
Podsumowanie
Volume analysis is integrated to detect potential trend reversals or continuations by highlighting bars with above-average volume and signaling significant volume changes using icons (↑ for rising volume confirming uptrends, ↓ for falling volume confirming downtrends, and ⚠️ for low volume indicating possible reversals). Bars are color-coded based on volume and price direction to visually represent trend strength.
Traders can combine signals from volume, EMAs, and support/resistance levels to make informed entry and exit decisions. A suggested strategy involves identifying the main trend using the 200 and 233 EMAs, waiting for pullbacks to shorter EMAs or support/resistance levels, and confirming with volume signals before entering trades. Exit points can be set at support/resistance levels or EMA lines. This indicator is suitable for enhancing trend, pullback, volume, reversal, and support/resistance analysis in various trading strategies.
Opinie klientów
5 | 100 % | |
4 | 0 % | |
3 | 0 % | |
2 | 0 % | |
1 | 0 % |


