
KeyLevels
Wskaźnik
328 pobrania
Wersja 1.0, Nov 2025
Windows, Mac
Od 24/04/2025
440.12M
Wolumen transakcji
20.97K
Zysk w pipsach
11
Sprzedaż
328
Bezpłatne instalacje
Opis
Przegląd
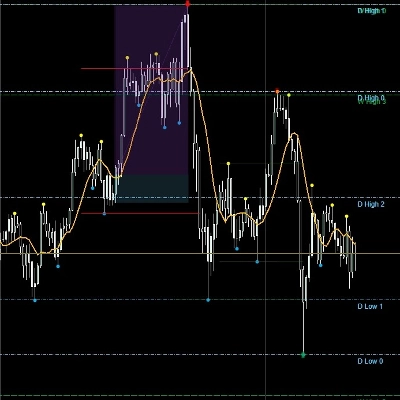
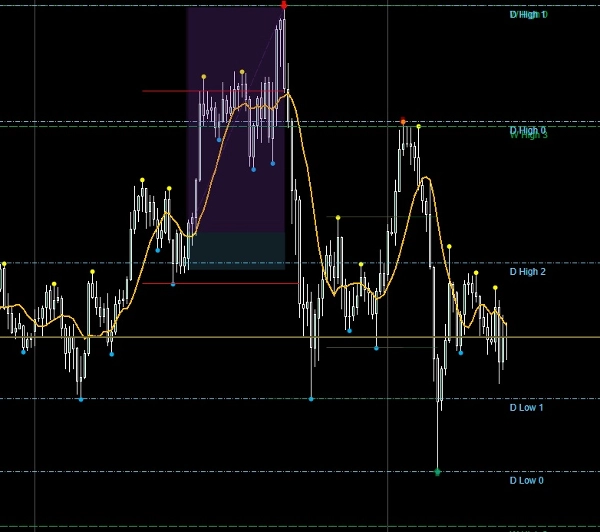
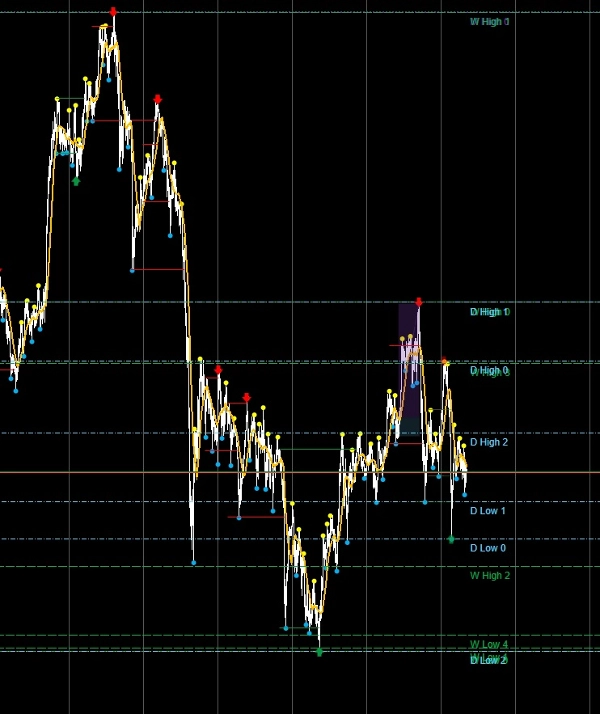
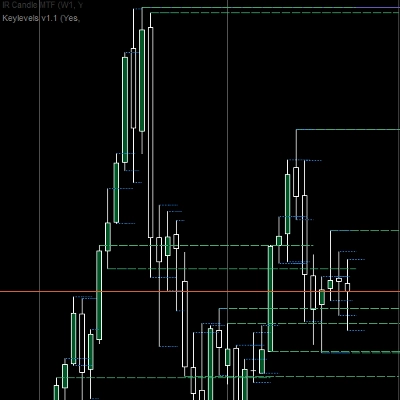
Wskaźnik Key Levels Indicator został stworzony dla traderów, którzy polegają na kotwicach z wyższych interwałów czasowych, aby kierować wykonaniem w ciągu dnia. Automatycznie identyfikuje i rysuje poziome linie dla miesięcznych, tygodniowych i dziennych maksimów i minimów, dając natychmiastową świadomość strukturalną na wielu interwałach czasowych. Każdy poziom jest w pełni konfigurowalny, dzięki czemu możesz dostosować wizualizacje do swojego planu działania i przepływu pracy.
Kluczowe funkcje
- 🔹 Poziomy wielointerwałowe – Rysuje maksima i minima z miesięcznych, tygodniowych i dziennych świec.
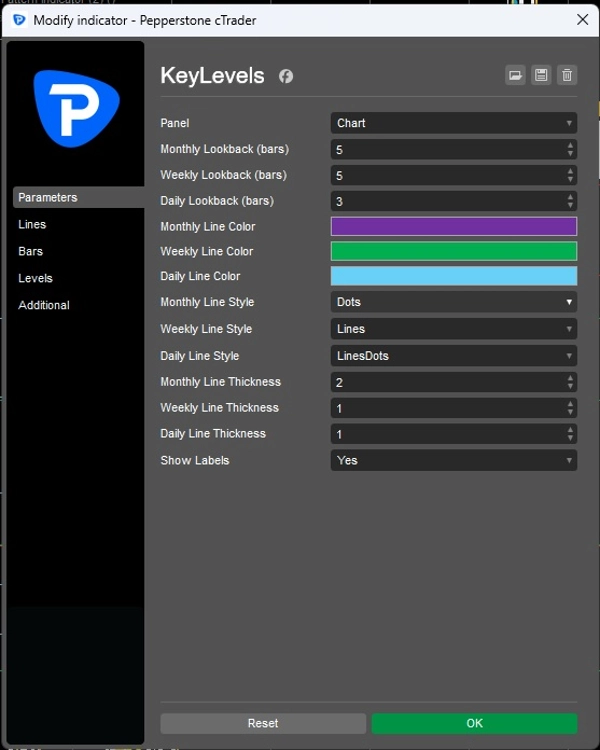
- 🔹 Niestandardowe okresy retrospekcji – Wybierz, ile poprzednich świec uwzględnić dla każdego interwału.
- 🔹 Personalizacja wizualna – Ustaw indywidualne kolory, style linii i grubość dla poziomów miesięcznych, tygodniowych i dziennych.
- 🔹 Opcja etykiet – Włączaj lub wyłączaj etykiety dla jasnej identyfikacji każdego poziomu.
- 🔹 Dynamiczne aktualizacje – Poziomy odświeżają się automatycznie wraz z zamknięciem nowych świec.
- 🔹 Czysta integracja z wykresem – Linie są rysowane bezpośrednio na wykresie dla łatwego odniesienia.
Korzyści dla traderów
- Kotwiczy twoje ustawienia intraday do obiektywnych poziomów z wyższych interwałów czasowych.
- Wzmacnia dyscyplinę i filtry przekonania, pokazując tylko kluczowe punkty strukturalne.
- Oszczędza czas, automatyzując rysowanie poziomów — koniec z ręcznym rysowaniem.
- Zwiększa przejrzystość podczas łączenia analizy wielu interwałów czasowych.
Zastosowania
- Intraday scalperzy mogą dopasować wejścia do poziomów dziennych lub tygodniowych.
- Traderzy swing mogą śledzić miesięczne kotwice dla ustawień kontynuacji.
- Traderzy korzystający z planu działania mogą zintegrować wskaźnik ze swoją zunifikowaną listą kontrolną dla natychmiastowej klasyfikacji.
Podsumowanie
Podsumowanie AI
The Key Levels Indicator automatically plots monthly, weekly, and daily high and low price levels on trading charts. Designed for traders who use higher-timeframe reference points to inform intraday decisions, it provides clear horizontal lines representing key structural levels across multiple timeframes. Users can customize the lookback periods, colors, line styles, and thickness for each timeframe, and toggle labels for easy identification. The indicator updates dynamically as new bars close, ensuring levels remain current. It integrates directly on the chart for straightforward visual reference. This tool supports various markets including Forex, cryptocurrencies, stocks, commodities, and indices, and is suitable for trading strategies such as scalping, breakout, and swing trading. By automating the plotting of significant price levels, it aids traders in aligning entries and managing setups with objective higher-timeframe anchors.
Profil wskaźnika
Dyskusja
Opinie klientów
0.0
Opinie: 0
Opinie klientów
Ten produkt nie ma jeszcze opinii. Wypróbowałeś(-aś) go już? Bądź pierwszy(-a) i powiedz o tym innym!
Częste pytania
BTCUSD
Forex
Signal
Breakout
Indices
EURUSD
Commodities
GBPUSD
NZDUSD
Prop
Scalping
Crypto
Stocks
XAUUSD
NAS100
USDJPY
Produkty dostępne za pośrednictwem cTrader Store, w tym boty handlowe, wskaźniki i wtyczki, dostarczane są przez deweloperów zewnętrznych i udostępniane wyłącznie w celach informacyjnych oraz w celu zapewnienia dostępu technicznego. cTrader Store nie jest brokerem i nie zapewnia doradztwa inwestycyjnego, nie udziela spersonalizowanych rekomendacji ani nie gwarantuje przyszłych wyników.
Więcej od tego autora



Cena
Od 24/04/2025
440.12M
Wolumen transakcji
20.97K
Zysk w pipsach
11
Sprzedaż
328
Bezpłatne instalacje