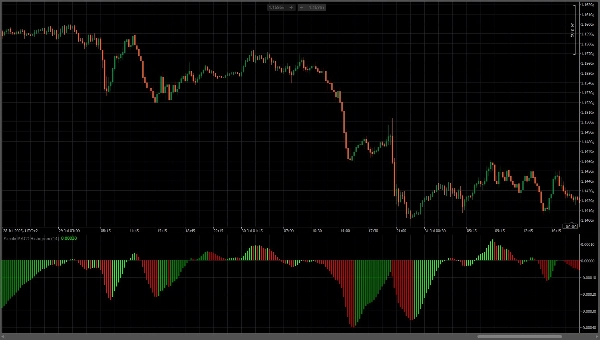
Simple MACD Histogram
Logo „Simple MACD Histogram”
03/08/2025
46
Desktop
Since 15/06/2025
Free installs
156
Przesłany obraz „Simple MACD Histogram”

This custom MACD Histogram indicator displays the MACD histogram with enhanced visual clarity styling. The indicator uses a fast EMA period of 14, automatically calculates the slow EMA as fast plus 2 (16). The indicator features highly contrasted color-coding for instant trend recognition: bright green bars indicate rising momentum (bullish), while red bars show falling momentum (bearish). The histogram bars extend symmetrically from a center zero line, creating an intuitive visual representation where green signals buy pressure and red signals sell pressure. This visualization style provides clear, unambiguous momentum signals and helps identify potential trend reversals and momentum shifts in price action.

Więcej od tego autora
Flex VWAP
Flexible VWAP indicator with timezone-aware, custom time periods and automatic DST handling.
Możesz także polubić
Wskaźnik
Indices
Commodities
Forex
Smart Floating Risk - Premium version
The Floating Risk Indicator is an essential tool for traders who prioritize risk management.
ictkillzonesfromnovem
ICT ALL KİLL ZONES, LONDON , ASİA, NY AM, NY LUNCH, NY PM
VegaXLR - ZigZag Alerts
cTrader ZigZag Alerts: Precision Swing Detection, Alerts, and Fibonacci.
Wskaźnik
NAS100
NZDUSD
XAUUSD
+11
RT Consolidation Zones
Identify and trade breakouts with Consolidation Zones! Visualize price consolidation areas for trading opportunities.
Wskaźnik
Indices
Prop
Stocks
+3
Smooth Heiken Ashi
The Smooth Heiken Ashi indicator is a refined charting tool designed to filter out market noise and highlight true price
SuperEmaColorRSI
This is a super indicator that integrates the RSI indicator with a dual moving average system.
Market Polarity Zones
implifies market analysis by automatically identifying bullish 🚀 or bearish 🐻 phases and marking key levels where ....
Wskaźnik
Grid
NAS100
NZDUSD
+15
RangeBoxFibonacci
With this Fibonacci retracement indicator, traders have full control over the retracement levels displayed on the chart.
Open Trade ProfitV1
A simple indicator that tracks the value of your open trades in pips.
Wskaźnik
NAS100
NZDUSD
Breakout
+13
Meridian Pivot Points Pro
🚀See the market’s framework, decide faster. Session-Aware Pivots. Auto Presets. Pro-Grade Zones.🚀
Wskaźnik
Grid
NAS100
NZDUSD
+17
Institutional Volume Supply Demand
Volume Profile Supply Demand
Fibonacci Pitchfan
Powerful all-in-one tool for traders seeking a clear, dynamic view of market structure. By merging pivots, trendlines &
EMA UP&DOWN 2025
SectorIndex Dual Moving Average Indicator: Your Market Compass 🧭
Market Sessions - Free
Track major trading sessions (Tokyo, London, New York) with customizable colors and visual sessions on your chart.
Wskaźnik
Signal
DARK POLL SIGNAL_noSourceCode
Dark Poll Signal Indicator.liquidity leakage,precedes the great movement, accumulation, distribution
Scalper Signal MTF
This code is a custom scalping indicator for the cTrader platform.
Automatic Fibonatti
Automatically plots Fibonacci retracement levels using the highest and lowest points of a customizable time range
Dynamic Candle Timer v1.5 2025
Dynamic Candle Timer is a fully customizable feature-packed indicator that offers multiple count-down/up modes and...