
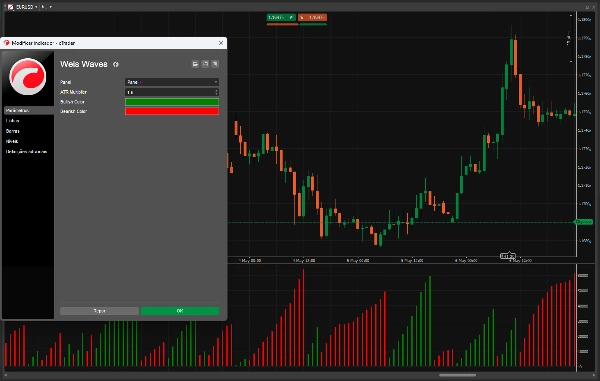
Weis Waves
Wskaźnik
53 pobrania
Wersja 1.0, May 2026
Windows, Mac
Opis
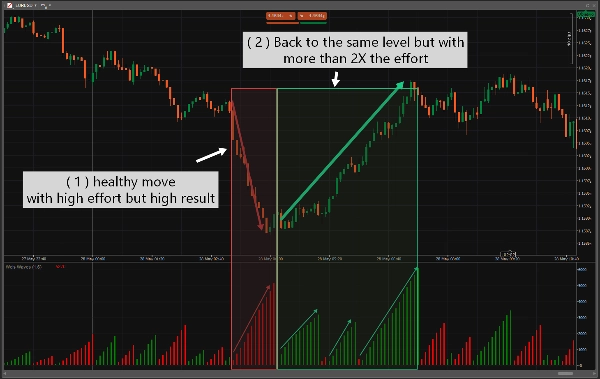
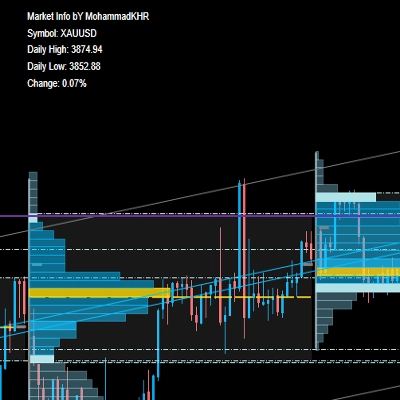
Wskaźnik Weis Wave opiera się na pracy Davida Weisa, technika, który połączył analizę Wyckoffa z nowoczesnym wykreślaniem wykresów. Używał tych fal wolumenu, aby zauważyć, kiedy inteligentni inwestorzy aktywnie uczestniczą lub się wycofują, zgodnie z zasadą Wyckoffa, że wolumen potwierdza ruch cen.
Kiedy go używać:
[ Potwierdzenie trendu ]
[ Wyczerpanie impetu ]
[ Dywergencja ][ Absorpcja]
Podsumowanie
Podsumowanie AI
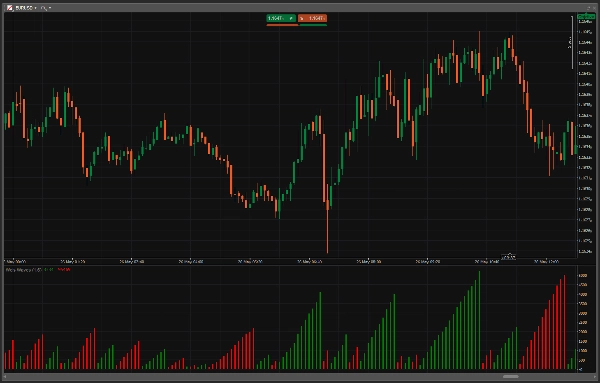
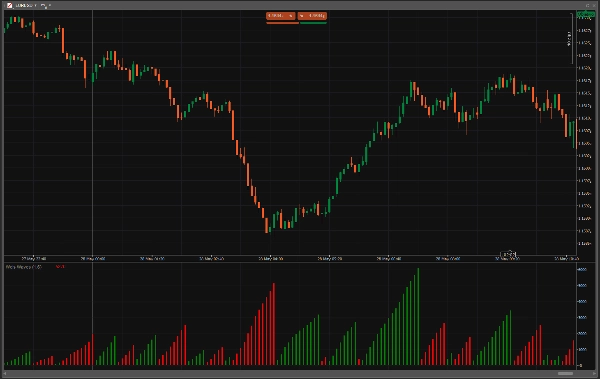
The Weis Waves indicator is based on the original work of David Weis, who integrated Wyckoff analysis with modern charting techniques. It analyzes volume waves to identify when informed market participants ("smart money") are actively involved or withdrawing, following the Wyckoff principle that volume confirms price movements. This indicator is used primarily for trend confirmation, detecting momentum exhaustion, spotting divergences, and identifying absorption phases in the market. It processes bar data with volume information and provides visualizations, filters, and trading signals related to trend strength, reversals, and divergences. The indicator is categorized under volume-based tools and supports analysis of supply and demand zones, imbalances, and on-balance volume concepts.
Profil wskaźnika
Kategoria wskaźnika
Wolumen
Typ wyjścia
Wizualizacja
Filtr
Sygnały
Wymagania dotyczące danych
Tylko słupki
Wolumen
Obsługiwane sygnały
Odwrócenie trendu
Siła trendu
Dywergencja
Opinie klientów
0.0
Opinie: 0
Opinie klientów
Ten produkt nie ma jeszcze opinii. Wypróbowałeś(-aś) go już? Bądź pierwszy(-a) i powiedz o tym innym!
Dyskusja
Częste pytania
Imbalance
OBV
Volume
Supply & Demand
Produkty dostępne za pośrednictwem cTrader Store, w tym boty handlowe, wskaźniki i wtyczki, dostarczane są przez deweloperów zewnętrznych i udostępniane wyłącznie w celach informacyjnych oraz w celu zapewnienia dostępu technicznego. cTrader Store nie jest brokerem i nie zapewnia doradztwa inwestycyjnego, nie udziela spersonalizowanych rekomendacji ani nie gwarantuje przyszłych wyników.


Cena
Od 24/03/2026
10
Sprzedaż
53
Bezpłatne instalacje