Opis
Belkhayate PRC (Kanał Regresji Wielomianowej)
1 krzywa. 3 pasma odchyleń. Czysta struktura.
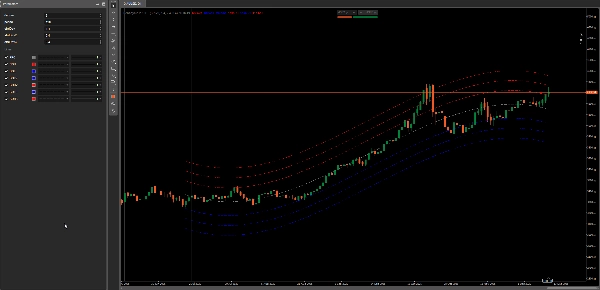
Belkhayate PRC to Kanał Regresji Wielomianowej z 3 kopertami odchylenia standardowego.
Pomaga w prosty sposób dostrzec strefy średnie, ekspansję i wyczerpanie: cena ma tendencję do oscylowania wokół gładkiej krzywej regresji — a zewnętrzne pasma często działają jak praktyczne obszary reakcji.
Ta wersja jest darmowa, ponieważ chcę, aby każdy trader mógł ją przetestować, zrozumieć i zdecydować, czy pasuje do jego sposobu pracy.
Co robi
Krzywa Regresji Wielomianowej (PRC)
- Dopasowuje gładką krzywą regresji do ostatnich N słupków (Twojego Okresu).
- Stopień 1–4: od łagodnego wygładzania do silniejszej krzywizny.
Pasma Odchyleń (3 poziomy)
- 3 koperty oparte na błędzie regresji (odchylenie standardowe).
- Przydatne jako „strefy” dla cofnięć, ekstremów i warunków powrotu do średniej.
Dlaczego jest użyteczny
- Jasność trendu bez opóźnionego nakładania MA
PRC daje Ci czysty „środek ciężkości” dla ostatniego Okresu. - Strukturalne ekstrema
Pasma pomagają ocenić, kiedy cena jest rozciągnięta, a kiedy wraca do normalnego obszaru. - Świetny do kontekstu + wykonania
Używaj wyższego TF dla kierunku/kontekstu i niższego TF dla wejść w krzywą lub strefy pasm.
Historia / skąd pochodzi pomysł
To narzędzie jest inspirowane klasyczną koncepcją kanałów regresji używanych w analizie technicznej (dopasowywanie linii/krzywej regresji do ceny i budowanie kopert na podstawie odchylenia).
Nazwa „Belkhayate” jest powszechnie kojarzona z spopularyzowaną wersją tego kanału w stylu PRC, rozpowszechnianą w społecznościach tradingowych.
Moja implementacja w cTrader to czyste przebudowanie, skupione na stabilności, ustawieniach i praktycznej użyteczności na nowoczesnych wykresach.
Zalecane użycie
- Rynek trendujący: handluj cofnięcia w kierunku PRC, zarządzaj ryzykiem używając najbliższego pasma
- Rynek w konsolidacji: kontruj ekstrema (pasmo 2 / pasmo 3) z powrotem w kierunku PRC
- Sprawdzenie zmienności: rozszerzające się pasma = rosnąca zmienność / przyspieszenie
Podsumowanie
This indicator helps traders identify mean zones, expansion phases, and exhaustion points by showing how price oscillates around the regression curve, with outer bands often acting as reaction areas. It is applicable across various markets including Forex, indices, commodities, stocks, and cryptocurrencies, supporting symbols like BTCUSD, EURUSD, GBPUSD, XAUUSD, NAS100, and USDJPY.
Recommended uses include trading pullbacks toward the PRC in trending markets, fading extremes in ranging markets, and monitoring volatility through band width changes. The tool is designed for clarity and practical usability on modern charts, suitable for combining higher timeframes for context with lower timeframes for execution.
Opinie klientów
5 | 100 % | |
4 | 0 % | |
3 | 0 % | |
2 | 0 % | |
1 | 0 % |