🎯 ÇOKLU ZAMAN DİLİMİ VOLATİLİTE BİLGİSİ
Volatilite Kopuşlarını Kaçırmayı Bırakın - Her Zaman Dilimini Aynı Anda Görün
Çoğu volatilite göstergesi size sadece tek bir perspektif sunar. Bizim Çoklu Zaman Dilimi Hareketli Volatilite Göstergemiz kısa vadeli (7), orta vadeli (21) ve uzun vadeli (63) dönemler boyunca tam resmi sunar - ayrıca yerleşik işlem sinyalleri tam olarak ne zaman harekete geçeceğinizi söyler.
⚡ NEDEN ÇOKLU ZAMAN DİLİMİ VOLATİLİTESİ HER ŞEYİ DEĞİŞTİRİR
Tek Zaman Dilimi vs Çoklu Zaman Dilimi Yaklaşımımız:
- ❌ Tek Dönem: Ağaçları görürsünüz ama ormanı kaçırırsınız
- ✅ Üç Dönem: Bağlam ile tam volatilite manzarası
Gerçek İşlem Senaryoları:
- Kısa vadeli sıçrama uzun vadeli sakinlik sırasında → Geçici gürültü (yoksay)
- Tüm zaman dilimleri yükseliyor → Gerçek rejim değişikliği (harekete geç)
- Kısa vadeli sakinlik uzun vadeli kaos arasında → Yanıltıcı sakinlik (dikkat)
🎯 PROFESYONEL ÖZELLİKLER
✨ ÜÇLÜ ZAMAN DİLİMİ GÖRÜNÜRLÜĞÜ
- StdDev 7: Anlık volatilite değişimlerini yakalayın (gün içi)
- StdDev 21: Orta vadeli volatilite (swing trading)
- StdDev 63: Uzun vadeli volatilite bağlamı (pozisyon trading)
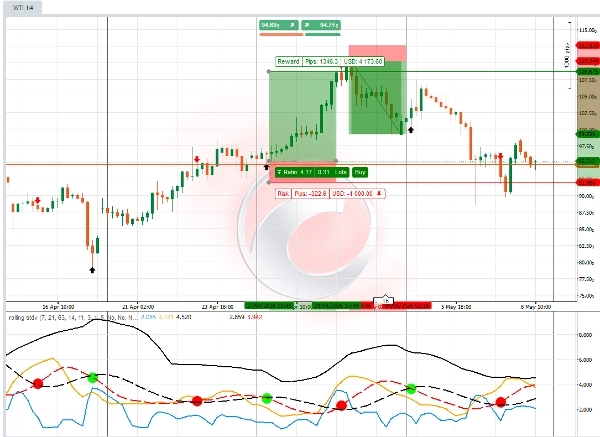
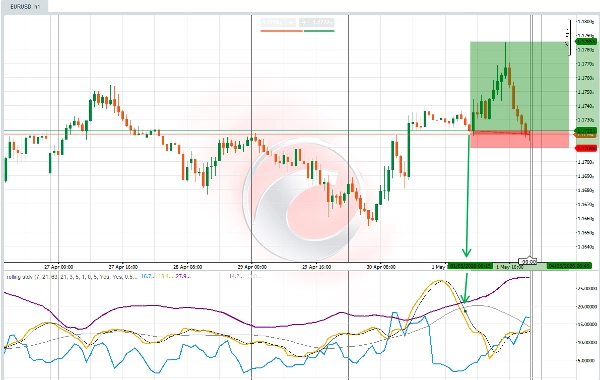
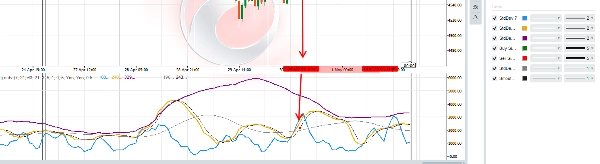
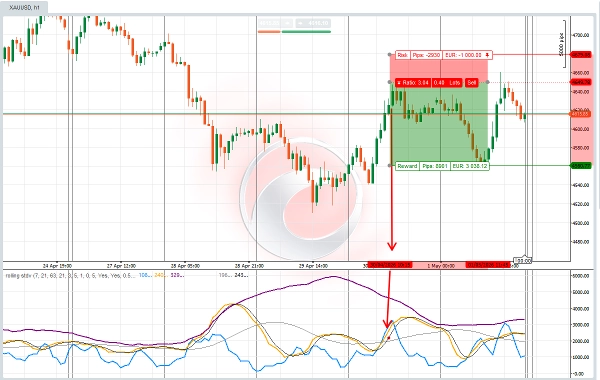
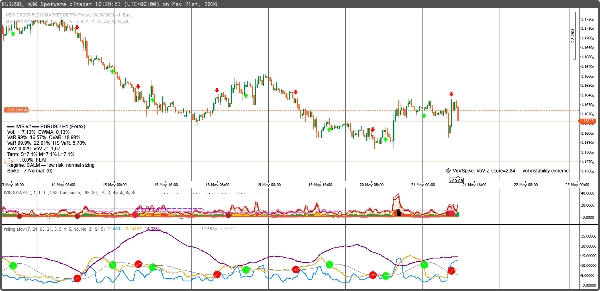
- Osilatör sinyali: ortalama Hareketli Standart Sapma sinyal çizgileri kesiştiğinde, hangi renkli Noktalar daha yüksek ve daha düşük volatilite ile fiyat hareketi yönünü doğrular. Büyük Kırmızı-NOKTA, Yeşil-NOKTA sinyali ile, Trader ayrıca grafikte giriş seviyelerini ve işlem büyüklüğünü belirlemeye yardımcı olabilecek Kırmızı-Ok, Yeşil-Ok sinyalini görür.
- Hareketli Standart Sapma, öngörücü piyasa sinyal mantığına sahip bir volatilite osilatörüdür. Paneldeki parametreler, traderın işlem yapmak istediği CFD enstrüman türüne göre kontrol edilmeli ve uyarlanmalıdır. Her Finansal Varlık CFD enstrümanı panel ayarlarında hafif farklılıklar gösterebilir. Traderlar, eğim, hızlı/orta kesişim sinyali ve yumuşatma özelliklerini etkinleştirerek volatilite okumalarının doğruluğunu ve hassasiyetini seçebilirler.
📊 GELİŞMİŞ VOLATİLİTE ANALİZİ
- Volatilite Kesişimleri: StdDev çizgilerinin kesişimi = rejim değişiklikleri
- Ortalama Dönüş Sinyalleri: Volatilitenin ortalamaya dönmesi
- Sıçrama Tespiti: Aşırı volatilite olayları
💡 BU İŞLEM STİLLERİ İÇİN MÜKEMMEL:
🎯 Volatilite Kopuşu Tüccarları
- Patlayıcı hareketlerden önce düşük volatilite sırasında giriş yapın
- Dönüşlerden önce yüksek volatilite sırasında çıkış yapın
- Üçlü onay kullanarak giriş zamanlamasını hassas yapın
📈 Ortalama Dönüş Tüccarları
- Volatilite uç noktalarını güvenle azaltın
- Aşırı genişlemiş piyasa koşullarını belirleyin
- Volatiliteyi karşıt bir gösterge olarak kullanın
🛡 Riskten Kaçınan Tüccarlar
- Yüksek volatilite dönemlerinden tamamen kaçının
- Sadece sakin, öngörülebilir piyasalarda işlem yapın
- Volatiliteyi pozisyon büyüklüğü rehberi olarak kullanın
📊 Opsiyon Tüccarları
- Yüksek volatilite sırasında zaman primi satışı
- Volatilite sıkışması sırasında opsiyon alımı
- Yanlış fiyatlama için IV ve HV analizi
Yerleşik Akıllı Sinyaller:
- ✅ Alış yapın: Volatilite eşik değerinin altına düştüğünde VEYA hareketli ortalamanın altına indiğinde
- ✅ Satış yapın: Volatilite eşik değerinin üzerine çıktığında VEYA hareketli ortalamanın üzerine çıktığında
📈 ELDE EDECEKLERİNİZ:
✅ Üçlü Zaman Dilimi Görünürlüğü - Volatilite bağlamını tahmin etmeye son
✅ Otomatik Al/Sat Sinyalleri - Optimal noktalarda net görsel oklar
✅ Volatilite Rejim Tespiti - Piyasaların sakin mi yoksa kaotik mi olduğunu bilin
✅ Özelleştirilebilir Eşikler - Her işlem stili veya varlığa uyum sağlar
✅ Profesyonel Renk Kodlaması - Anında görsel anlayış
💰 ÖZEL LANSMAN FİYATI: 50$
(Normal fiyat: 100$)
Değer Dağılımı:
- StdDev 7 Göstergesi: 29$ değerinde
- StdDev 21 Göstergesi: 29$ değerinde
- StdDev 63 Göstergesi: 29$ değerinde
- İşlem Sinyalleri: 49$ değerinde
- Toplam Değer: 136$
- Sizin Fiyatınız: 50$ ( %35 Tasarruf)
Dahil: Tam gösterge Renk
🎁 BONUS: Ücretsiz Volatilite Zamanlama Rehberi
Satın alma işlemi, "Çoklu Zaman Dilimi Volatilite Ustalığı" - 39$ değerinde ÜCRETSİZ içerir.
İçerik:
- Volatilite sıkışması işlem stratejileri
- Çoklu zaman dilimi onay teknikleri
- Volatil dönemler için risk yönetimi
- Gerçek dünya işlem örnekleri
🚀 VOLATİLİTE ZAMANLAMASINDA USTALAŞMAYA HAZIR MISINIZ?
"Sepete Ekle"ye tıklayın ve piyasa volatilitesini görme ve işlem yapma şeklinizi dönüştürün.
"Oradaki her volatilite göstergesini denedim. Bu yerleşik sinyallerle üçlü zaman dilimi yaklaşımı, prop firmamda günlük olarak kullandığım şey."
- Sarah Rodriguez, Profesyonel Swing Trader
BU PİYASALAR İÇİN MÜKEMMEL:
📊 Hisse Senetleri ve ETF'ler
- SPY, QQQ volatilite zamanlaması
- Volatiliteye dayalı sektör rotasyonu
- Kazanç volatilite oyunları
💹 Forex Pariteleri
- Ana paritelerin volatilite analizi
- Carry trade risk değerlendirmesi
- Kopuş onayı
📈 Emtialar
- Altın volatilite döngüleri
- Petrol volatilite sıçramaları
- Tarım sezonluk volatilitesi
🔄 Kripto Paralar
- BTC/ETH volatilite rejimleri
- Altcoin volatilite fırsatları
- Kripto risk yönetimi
Sonuç: Bu sadece başka bir standart sapma göstergesi değil. Piyasaların ne zaman hareket edeceğini tam olarak gösteren eksiksiz bir volatilite zamanlama sistemidir.
Sınırlı Lansman Teklifi: İlk 150 kopya 89$ (30$ tasarruf)
"Amatör ve profesyonel işlem arasındaki fark genellikle volatilite zamanlamasına bağlıdır. Bu gösterge o farkı kapatıyor."
Şimdi Sepete Ekle → Volatiliteyi Profesyonel Gibi İşlemeye Başlayın.
5 | 50 % | |
4 | 50 % | |
3 | 0 % | |
2 | 0 % | |
1 | 0 % |