¡Deja de adivinar la estructura del mercado, este indicador es para ti!
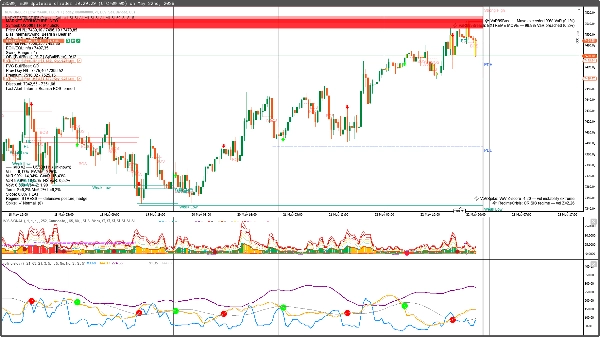
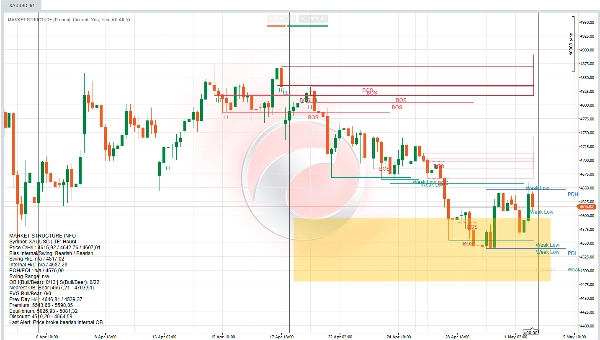
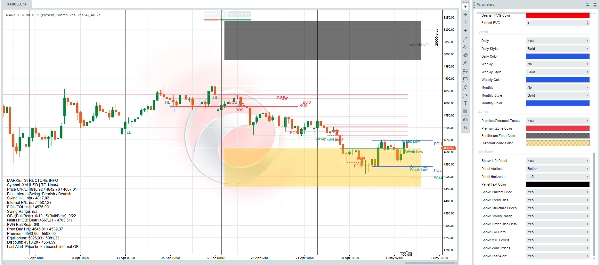
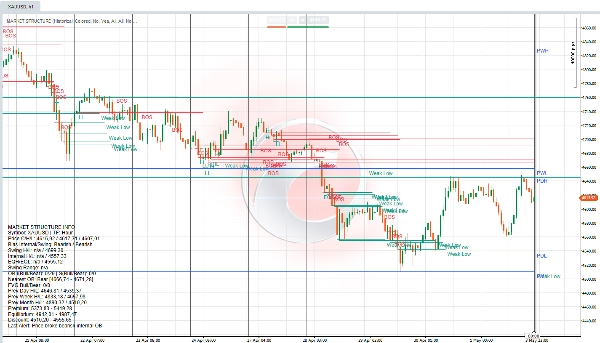
Indicador de Estructura del Mercado que identifica y traza automáticamente los elementos clave de la estructura del mercado, incluyendo BOS (Ruptura de Estructura), CHoCH (Cambio de Carácter), Bloques de Orden, Brechas de Valor Justo, Altos/Bajos Iguales, y Zonas de Prima/Descuento. Cuenta con detección de estructura en doble marco temporal (Interno y Swing), seguimiento de niveles en múltiples marcos temporales (Diario/Semanal/Mensual) y alertas en tiempo real completas. Totalmente personalizable con modos de visualización en color/monocromo, filtros de confluencia y un panel de información detallado.
💰 Compra única | Uso ilimitado | Sin suscripciones
Paga una vez, úsalo para siempre en todas tus cuentas de cTrader. Sin cuotas mensuales, sin renovaciones, sin costos ocultos.
Cómo operar con este indicador
Identificación de tendencia
- Sesgo alcista: Precio por encima de la estructura swing con marcadores BOS consecutivos apuntando hacia arriba
- Sesgo bajista: Precio por debajo de la estructura swing con marcadores BOS consecutivos apuntando hacia abajo
- Señal de reversión: CHoCH indica posible cambio de tendencia—espera confirmación
Estrategias de entrada
Entradas en Bloques de Orden:
- Alcista: Entra en largo cuando el precio retrocede al OB alcista (zona azul) en tendencia alcista
- Bajista: Entra en corto cuando el precio retrocede al OB bajista (zona roja) en tendencia bajista
- Coloca el stop-loss debajo/encima del bloque de orden
Entradas en Brechas de Valor Justo:
- El precio suele volver para llenar las FVG antes de continuar la tendencia
- Entra en la dirección de la tendencia cuando el precio toca la zona FVG
- Usa los bordes de la FVG como soporte/resistencia
Niveles clave para confluencia
- Alto/Bajo fuerte: Puntos swing no rotos—actúan como soporte/resistencia principal
- Alto/Bajo débil: Puntos swing rotos—objetivos potenciales de liquidez
- Altos/Bajos iguales: Piscinas de liquidez—espera rupturas o reversiones
- Zona de Prima (por encima del 50%): Busca cortos en estructura bajista
- Zona de Descuento (por debajo del 50%): Busca largos en estructura alcista
Gestión de riesgo
- Usa Estructura Interna para stops más ajustados (scalping)
- Usa Estructura Swing para stops más amplios (swing trading)
- Atento a las alertas de mitigación de OB—sal si el bloque de orden se rompe
- Monitorea los niveles MTF (altos/bajos diarios/semanales) para soporte/resistencia principal
Ejemplo práctico
- Identificar tendencia: La estructura swing muestra secuencia BOS alcista
- Esperar retroceso: El precio retrocede a la zona de descuento
- Buscar entrada: Bloque de orden alcista o FVG alineados con el retroceso
- Confirmar: La estructura interna muestra CHoCH de vuelta a alcista
- Entrar en largo: En OB/FVG con stop debajo del mínimo swing
- Objetivo: Próximo alto débil o piscina de liquidez (altos iguales)
Consejo profesional: Combina alertas—cuando el precio rompe un OB interno bajista mientras forma un CHoCH alcista en zona de descuento, configuración larga de alta probabilidad.
⚠️ Descargo de responsabilidad
DATARUMALGORITHMICA desarrolla y proporciona indicadores técnicos para plataformas de trading como desarrollador de software. El uso de estos indicadores queda totalmente a discreción de los traders individuales, quienes eligen libremente incorporarlos en su análisis y toma de decisiones personales. Este indicador es una herramienta de análisis técnico y no constituye asesoramiento financiero, recomendaciones de inversión ni señales de trading. El trading de CFD y forex implica un riesgo sustancial de pérdida y no es adecuado para todos los inversores. Todas las decisiones de trading ejecutadas por los usuarios de este indicador son responsabilidad exclusiva de los clientes. DATARUMALGORITHMICA no se responsabiliza por ningún resultado, pérdida o daño derivado del uso de este software. Los usuarios deben asegurarse de comprender completamente los riesgos involucrados y buscar asesoramiento independiente si es necesario.
5 | 100 % | |
4 | 0 % | |
3 | 0 % | |
2 | 0 % | |
1 | 0 % |