
Descrição
1. O que é o Hyper Trend e para quem é
Hyper Trend é um indicador sobreposto de seguimento de tendência para c Trader. Ele oferece uma única linha de tendência móvel fácil de ler, uma zona de referência para entrar nessa tendência, marcadores de sinal claros, enquadramento opcional de stop-loss / take-profit no gráfico, e um painel interativo para que você possa ajustar a maioria do que vê ao vivo, sem reabrir as configurações.
O objetivo do design é deliberadamente simples: pegar métodos de negociação bem estabelecidos e gerar tendências e sinais que sejam realmente fáceis de ler — depois tornar tudo leve, não intrusivo e rápido de configurar.
É adequado para todos os tipos de traders, independentemente da experiência.
-
-
- Iniciantes obtêm uma leitura clara sobre direção e risco.
- Traders experientes obtêm uma sobreposição rápida e configurável que não atrapalha a leitura de preço deles.
-
Foi construído para ser simples e eficiente na superfície enquanto fundamentado em aplicações pesquisadas por baixo, e fácil de configurar e ajustar.
"Seja o que for que você negocie e por mais experiente que seja, Hyper Trend foi feito para ser fácil de ler, fácil de configurar e fácil de ajustar."
2. A ideia por trás
Médias móveis, ATR, Super Trend, filtros de suavização — estes são métodos bem conhecidos e estabelecidos
, e existem precisamente para fazer o que Hyper Trend faz: transformar preço bruto em uma
tendência legível com sinais utilizáveis.
Então por que outra ferramenta? Porque na prática, a maioria dos indicadores nesse espaço compartilha os mesmos
problemas:
-
-
- Reembalagem. Grande parte do que é publicado é a mesma ou velha lógica, renomeada e
republicada repetidamente, com pouco realmente novo por baixo. - Confusão no gráfico. Muitos acumulam tanto no gráfico que ler o próprio preço torna-se quase
impossível, e a lógica interna às vezes trabalha contra a intenção real do trader. - Vantagem em declínio. Os conceitos subjacentes parecem bons, mas nos mercados em rápido desenvolvimento de hoje — especialmente em prazos mais curtos — eles frequentemente falham em manter qualquer vantagem real.
- Reembalagem. Grande parte do que é publicado é a mesma ou velha lógica, renomeada e
-
Hyper Trend tem como premissa combater os três. Mantém a espinha dorsal estabelecida (suavização,
bandas de volatilidade, direção estilo Super Trend) mas aplica abordagens mais recentes ao
pré-processamento de dados, suavização de preço e manejo de sinais — o tipo de técnicas discutidas
em artigos científicos, jornais de negociação e pesquisas acadêmicas. Todos os links de referência podem ser encontrados na descrição do vídeo.
REFERÊNCIAS DE FONTES
- ECB: A TREND-CYCLE(-SEASON) FILTER
- Kalman filter demystified: from intuition to probabilistic graphical model to real case in financial markets
- Financial Pricing Models in Continuous Time and Kalman Filtering
- The Holt-Winters filter and the one-sided HP filter: A close correspondence
- A Bayesian Framework for Trend and Seasonality Decomposition
- Hedge Fund Returns, Kalman Filter, and Errors-in-Variables
- Moving Averages for Financial Data Smoothing
- Optimizing the Performance of the Fractal Adaptive Moving Average Strategy: The Case of EUR/USD
- Kalman Filter and Optimal Smoothing Derived by the Regression Model
O propósito é testar uma pergunta simples na prática: esses conceitos teóricos,
aplicados sobre ferramentas estabelecidas, podem trazer vantagem real a favor do trader? Hyper Trend é
um exemplo concreto dessa tentativa — métodos estabelecidos, modernizados onde importa, com
legibilidade tratada como uma característica de primeira classe, não como um pensamento posterior.
"Mesmas bases confiáveis — média, volatilidade, lógica de tendência — mas com
pré-processamento moderno e foco implacável em manter o gráfico legível."
3. Pontos-chave — o que o torna diferente
Uma sobreposição não intrusiva, por design. Mantém um equilíbrio deliberado entre mostrar o que é realmente útil sobre o preço e não distorcer o fluxo de preço que você está lendo.
Otimizado para c Trader — rápido e leve. É projetado para carregamento rápido e baixo uso de CPU, e desenhado para funcionar suavemente mesmo com múltiplas instâncias anexadas e rodando ao mesmo tempo, em vários gráficos ou símbolos, para que sua plataforma permaneça responsiva.
Um pipeline limpo sob o capô.
-
-
- Escolha uma fonte de preço. Você escolhe qual preço o cálculo usará — fechamento, um
ponto médio como HL2, um preço típico como HLC3, e assim por diante (a configuração da fonte). - Pré-processamento opcional. Você pode passar esse preço por velas Heikin-Ashi e/ou um filtro de Kalman antes de qualquer outra coisa, para suavizar séries ruidosas — isso faz parte da
ideia de "processamento modernizado". - Base de tendência suavizada. A fonte escolhida é suavizada para formar a base da tendência sobre a qual o restante
da lógica é construída — projetada para acompanhar o movimento dominante. - Bandas de volatilidade. Um ATR suavizado por Wilder define uma banda acima e abaixo dessa base.
- Lógica SuperTrend. A "aderência" padrão do SuperTrend então decide qual lado está ativo:
em uma tendência de alta, a banda inferior torna-se a linha móvel; em uma tendência de baixa, a banda superior
é a linha móvel. Quando o preço fecha através da banda ativa, a tendência inverte.
- Escolha uma fonte de preço. Você escolhe qual preço o cálculo usará — fechamento, um
-
"Foi feito para ficar leve no gráfico — mostrar o que ajuda, esconder o que
não ajuda, e nunca atrapalhar o próprio preço. Um clique no painel leva você de volta ao
preço limpo sempre que quiser."
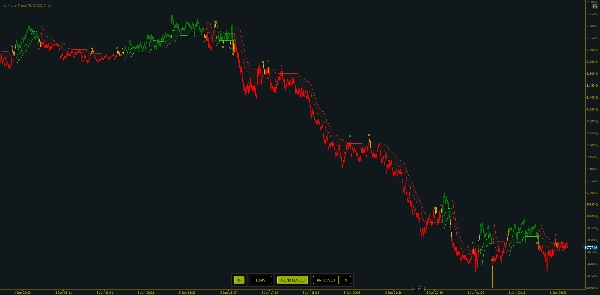
4. Lendo o gráfico — os visuais principais
1. A linha móvel
-
- Verde = tendência de alta (linha abaixo do preço)
- Vermelho = tendência de baixa (linha acima do preço)
- Uma mudança de cor é uma inversão de tendência
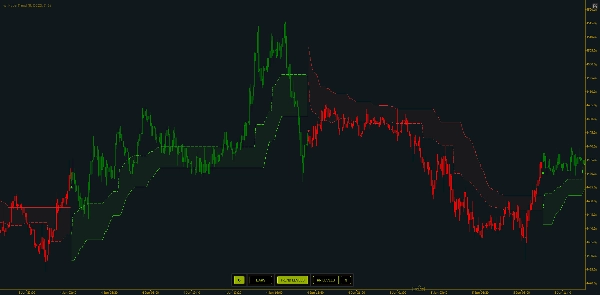
2. Zonas de entrada
-
- Quando ativada, um nível pontilhado fica uma fração do caminho da linha móvel em direção à banda oposta — uma referência de "pullback para o valor" dentro da tendência atual, em vez de perseguir o extremo.
Distância da Zona de Entradacontrola o quão longe ela fica.
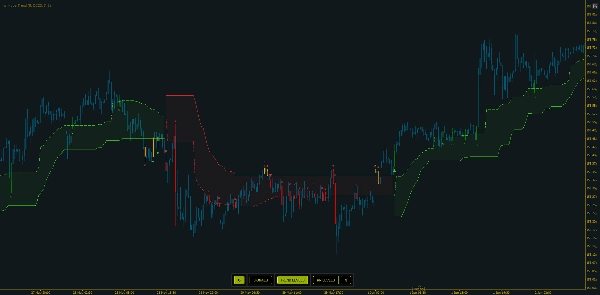
3. Coloração das barras
-
- As barras podem ser coloridas com base na direção ativa, com três estilos:
-
- Regular (bull/bear por direção),
- Modo 1, fornece uma visualização diferente nas fases de transição
- Modo 2, que marca adicionalmente barras neutras de transição.
A linha móvel verde/vermelha visível é o resultado final. Todo o resto — zonas de entrada, marcadores, linhas SL/TP, coloração das barras — é sobreposto ao mesmo estado de direção.
"A cor da linha é seu viés de regime num relance; a zona pontilhada é onde a tendência oferece uma entrada mais razoável."
5. Sinais e Alertas
Hyper Trend distingue três tipos de sinal. Cada sinal imprime um marcador rotulado na barra confirmada e é ativável independentemente:
-
- Sinais de troca (ativados por padrão) — disparados quando a direção da troca de tendência (ou viés) ocorre. Este é o sinal principal.
- Sinais de cruzamento de entrada — disparados em um cruzamento validado de ida e volta da zona de entrada dentro de uma tendência existente (o preço sai e recupera a zona). Para temporizar entradas em pullback.
- Sinais de cruzamento de tendência — disparados em um cruzamento validado de ida e volta da linha móvel em si. No modo de coloração mais rico, um cruzamento da linha de tendência em uma barra de transição/neutra é tratado como um marcador de saída em vez de uma nova entrada.
- Sinais de saída — visíveis quando a Coloração de Barra - Modo 2 está ativada, esses sinais podem ajudar a indicar quando uma tendência está perdendo força e alguns barras antes dos sinais de troca. São úteis para identificar períodos de baixa volatilidade com participação de mercado reduzida que produzem ação de preço picotada ou em faixa.
Alertas: quando ativados, Hyper Trend toca um som escolhido e mostra um popup para cada sinal detectado. Os alertas seguem as mesmas ativações — apenas os tipos de sinal que você ativou irão alertar — e o botão de alerta do painel no gráfico ativa/desativa eles ao vivo. O popup é conciso: símbolo e período, tipo e direção do sinal, e o preço atual.
"Comece apenas com o sinal de troca para um gráfico limpo, depois adicione os sinais de cruzamento quando quiser um tempo de entrada mais refinado. Cada um pode alertar você com som e popup."
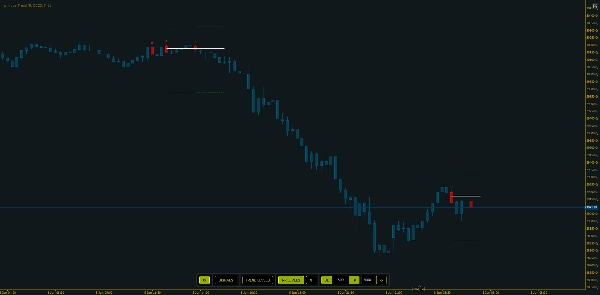
6. Planeje suas negociações — níveis de Risco / Recompensa no gráfico
Com os níveis de Stoploss / Alvo ativados, cada barra de sinal recebe três linhas horizontais curtas: uma linha de Entrada no preço médio da barra de sinal, uma linha de SL a uma distância fixa de pips do lado perdedor, e uma linha de TP a uma distância fixa de pips do lado vencedor.
Os níveis são pré-estendidos por um número fixo de barras e não continuam crescendo depois — uma captura no sinal. Um novo sinal trunca o conjunto anterior para que os níveis não se misturem. Entrada, SL e TP têm cada um sua cor, com larguras e estilos de linha ajustáveis.
"Ele enquadra a negociação visualmente — entrada, stop, alvo — para que você veja o risco-recompensa antes de se comprometer, depois mantém o gráfico organizado limitando quantos conjuntos permanecem."
7. O painel interativo — altere os visuais ao vivo
O painel no gráfico altera o que é exibido imediatamente, sem reabrir parâmetros.
Os botões ativos são destacados; o painel sempre reflete o estado atual. Você tem várias opções para posicioná-lo no gráfico, ou escondê-lo completamente.
"Tudo que você normalmente mexeria nas configurações — coloração, níveis de tendência, linhas de risco e as distâncias SL/TP — está a um clique no painel. Digite novas distâncias, clique em atualizar, e os níveis se atualizam."
8. Abordagens de negociação — alguns exemplos
Abordagem A — Negocie a troca (seguimento de tendência). Use os sinais de troca como seu principal indicativo: entre na nova direção em uma inversão confirmada, e trate a linha móvel como sua invalidação visual. Uma inversão de volta para a cor oposta é a saída/reversão. Leitura mais simples e limpa.
Abordagem B — Entrada em pullback dentro de uma tendência. Com a tendência já estabelecida, espere o preço recuar para a zona de entrada e ative os sinais de cruzamento de entrada para que o recross marque o momento em que o preço recupera a zona — entrando na tendência a um valor melhor em vez de perseguir o extremo.
Abordagem C — Risco enquadrado em cada setup. Ative Níveis RR, defina distâncias SL / TP que correspondam à volatilidade do símbolo. Você vê a entrada / stop / alvo antes de se comprometer, e gerencia sua negociação de acordo.
Nas três, o fio comum é o julgamento: aja na direção da tendência, confirme com a ação de preço ao redor, e use a linha como sua referência — Hyper Trend é a leitura, você coloca e gerencia a negociação.
"Negocie a inversão, ou espere o pullback para a zona, ou enquadre cada setup com as linhas de risco — escolha a abordagem que se encaixa no seu estilo. Entenda o contexto do mercado e combine com outras ferramentas como RSI ou MACD, identifique divergências. Essa combinação é onde ele se destaca."
9. Como avaliá-lo
Verificações práticas: role o histórico para trás e veja se a linha de tendência manteve você do lado certo de movimentos sustentados e onde as inversões se concentraram; compare duas configurações lado a lado (ex. multiplicador ATR diferente ou lookback de tendência) para ver o trade-off entre responsividade e suavidade; revise os enquadramentos SL/TP historicamente para avaliar com que frequência o alvo foi alcançado antes do stop nas distâncias escolhidas; combine com um mercado (claramente em tendência vs. em faixa apertada); e preste atenção no relógio — ele identifica seus melhores regimes enquanto o mercado está realmente se movendo, então compare horas ativas com períodos calmos, fora do pico.
"Avalie rolando o histórico e comparando configurações — quão limpas são as inversões, quão bem a zona de entrada temporiza os pullbacks, e como os enquadramentos SL/TP se resolvem?"
10. Limitações e outras notas
Hyper Trend foi construído para estar acima da qualidade de indicadores genéricos e reembalados — mas é uma ferramenta, não uma bola de cristal:
-
- Ainda pode produzir sinais falsos. Agir mecanicamente em cada sinal não produzirá resultados positivos por si só.
- Recompensa habilidade e contexto. Assume uma habilidade básica para ler preço e um senso do mercado ao redor. Combinado com esse contexto e uma gestão de dinheiro sólida, torna-se uma ferramenta realmente poderosa — e essa combinação tende a produzir resultados positivos a longo prazo.
- É melhor quando o mercado se move. Leituras feitas em períodos calmos, ou completamente fora do horário regular de negociação, perdem parte dessa qualidade.
- Ferramentas de tendência atrasam e geram ruído. Como qualquer abordagem estilo SuperTrend, inversões podem ocorrer tardiamente em reversões e se agrupar em faixas; a suavização e a banda ATR reduzem isso, mas não eliminam.
- Linhas SL/TP são uma ajuda para planejamento, não uma garantia. Referências fixas de pips a partir do preço médio da barra de sinal; não consideram spread, slippage ou seu preenchimento real, e não são móveis.
"Traga leitura básica de preço, contexto de mercado e gestão de dinheiro, e ele se torna realmente poderoso a longo prazo — mais forte quando o mercado está se movendo."
HyperTrend entregue como uma sobreposição limpa e não intrusiva com temporização de entrada embutida, sinais claros, enquadramento de risco no gráfico e um painel de controle ao vivo. Simples de usar, leve no cTrader, e feito para qualquer trader, em qualquer símbolo ou período.
"Simples de configurar, leve para rodar, e feito para ajudar qualquer trader a ler a tendência, marcar entradas e saídas, e enquadrar o risco — mantido limpo e legível."
Resumo
Under the hood, HyperTrend processes price data through selectable sources and optional smoothing filters such as Heikin-Ashi and Kalman filters. It applies volatility bands based on ATR and SuperTrend logic to determine active trend direction. The indicator offers three types of signals—trend switches, entry zone crosses, and trailing line crosses—with labeled markers and optional alerts via sound and popups.
Risk management is supported through on-chart stop-loss and take-profit levels displayed as horizontal lines at fixed pip distances from entry points, helping traders visualize risk/reward before committing. An interactive on-chart panel allows live adjustment of visual settings and parameters without reopening menus.
HyperTrend is optimized for fast, low-CPU performance on cTrader, suitable for all trader experience levels, and applicable across symbols and timeframes. It emphasizes readability and simplicity while incorporating modern data processing techniques to enhance traditional trend-following methods.


