
Descrição
TIB — Indicador de Barras de Desequilíbrio de Tick. Detecte Informações do Mercado Antes dos Movimentos de Preço
Versão 2.0
Use a seção de comentários para pedir mais detalhes
Disponível para sessão em vídeo com guia de configuração após a compra
Tick Imbalance Bars traz análise de microestrutura de mercado de nível institucional para o cTrader. Baseado na pesquisa inovadora de Marcos López de Prado, detalhada em seu livro Advances in Financial Machine Learning, este indicador amostra dados de preço não por tempo ou volume — mas pela chegada de informação.
O Insight Principal
Barras tradicionais (tempo, tick, volume) amostram os mercados uniformemente, perdendo momentos críticos quando traders informados agem. Tick Imbalance Bars resolve isso detectando quando a pressão de compra ou venda excede níveis esperados — sinalizando a presença de traders informados e possível movimento de preço antes que o mercado alcance o equilíbrio.
Como Funciona
O indicador aplica a regra do tick para classificar cada negociação como pressão de compra (+1) ou venda (-1). Em seguida, acumula esses ticks assinados até que o desequilíbrio cumulativo (θT) exceda um limite dinâmico calculado usando uma Média Móvel Exponencialmente Ponderada (EWMA). Esse limite esperado se adapta às condições do mercado analisando a probabilidade histórica de ticks de compra vs. venda. Quando o limite é ultrapassado, uma nova barra TIB é criada — cada barra contendo aproximadamente quantidades iguais de informação de mercado, independentemente do volume ou do tempo decorrido.
Principais Características
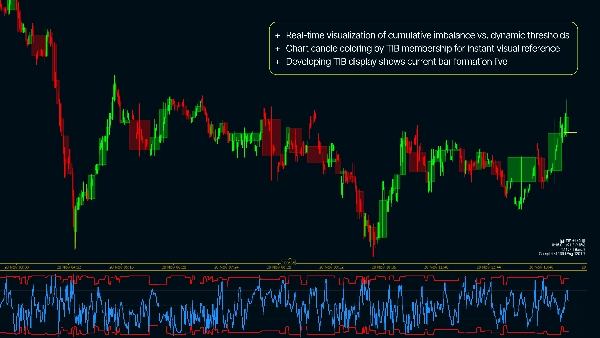
- Visualização em tempo real do desequilíbrio cumulativo vs. limites dinâmicos
- Coloração das velas do gráfico por associação TIB para referência visual instantânea
- Exibição do TIB em desenvolvimento mostra a formação da barra atual ao vivo
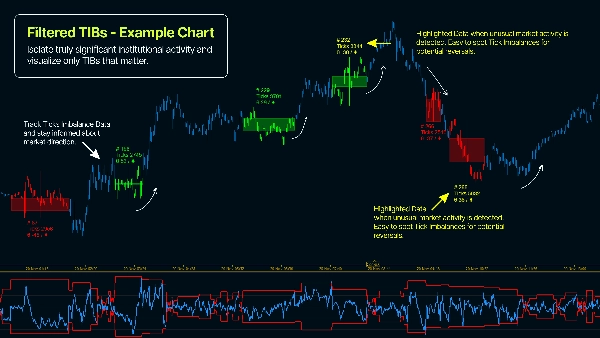
- Filtro de Ticks Mínimos para exibir apenas barras estatisticamente significativas
- Parâmetros totalmente configuráveis de Tamanho Esperado da Barra e EWMA
- Métricas do painel monitorando intensidade do desequilíbrio e densidade de informação
Por Que Usar Tick Imbalance Bars?
- Amostre com mais frequência durante períodos de alta informação — capturando volatilidade acionável
- Detecte atividade de trading informada antes que o equilíbrio de preço seja alcançado
- Reduza o ruído de participantes de mercado não informados e fluxo de ordens de varejo
- Alcance melhores propriedades estatísticas (retornos IID semelhantes a Gaussianos) do que a amostragem baseada em tempo
- Aplique metodologia comprovada de finanças quantitativas usada por traders institucionais
- Identifique informação assimétrica no fluxo de ordens — um preditor comprovado da direção do preço
Guia Prático de Configuração para Configuração Base ( ! )
- Aplique o indicador no timeframe de 1 minuto (ou menor - use gráficos baseados em tick)
- E[T] - Insira o número esperado de ticks por barra para amostragem (comece com 1000)
- EWMA Alpha - [0,001 - 0,5], onde 0,001 produzirá resultados mais estáveis (em teoria) enquanto 0,5 produzirá TIBs baseados em dados mais recentes
- Desequilíbrio Inicial - recomendado 0,5, mas você pode experimentar (0,5 = desequilíbrio neutro na inicialização)
Resumo
The indicator classifies each trade as buying (+1) or selling (-1) pressure using the tick rule and accumulates these signed ticks until a dynamic threshold—calculated via an Exponentially Weighted Moving Average (EWMA)—is exceeded. When this threshold is breached, a new Tick Imbalance Bar (TIB) is formed, each containing roughly equal market information regardless of elapsed time or volume.
Key features include real-time visualization of cumulative imbalance versus dynamic thresholds, candle coloring by TIB membership, live display of the developing bar, a minimum ticks filter for statistical significance, configurable expected bar size and EWMA parameters, and dashboard metrics tracking imbalance intensity and information density.
This approach enables more frequent sampling during high-information periods, reduces noise from uninformed trades, and provides better statistical properties than time-based sampling. It supports markets including Forex, indices, and cryptocurrencies, and is suitable for strategies such as scalping and breakout trading.
Avaliações de clientes
5 | 100 % | |
4 | 0 % | |
3 | 0 % | |
2 | 0 % | |
1 | 0 % |


