
Descrição
Indicador Price Jump Exit and Re-entry (PjER) é um indicador de gestão de risco baseado no artigo acadêmico “A dynamic price jump exit and reentry strategy for intraday trading” por Koegelenberg & van Vuuren (2024), publicado no Journal Expert Systems With Applications.
Inovação Principal
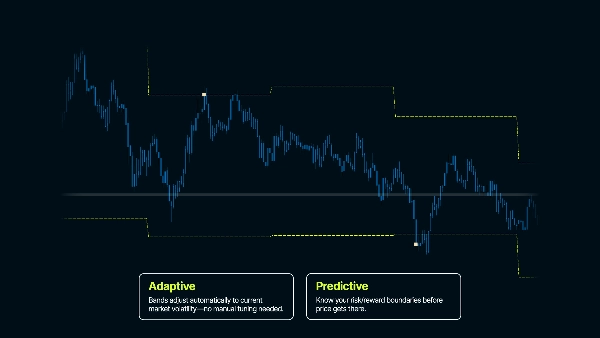
- Estimativas de VaR de perdas potenciais antes que ocorram
- Robustez contra fortes tendências de mercado em prazos curtos
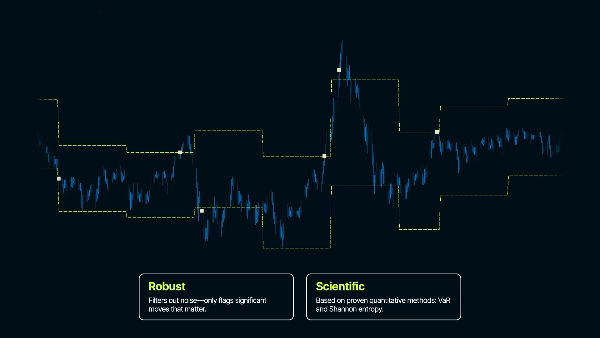
- Análise de correção do mercado pós-salto para tempo seguro de reentrada
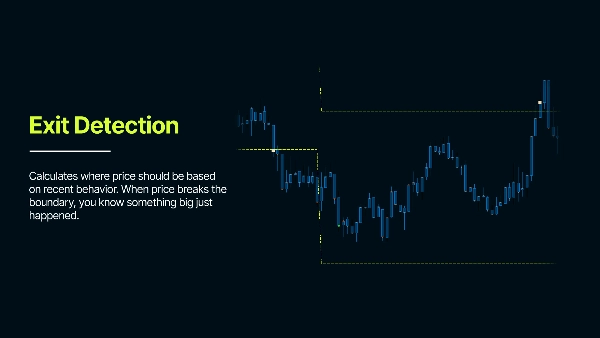
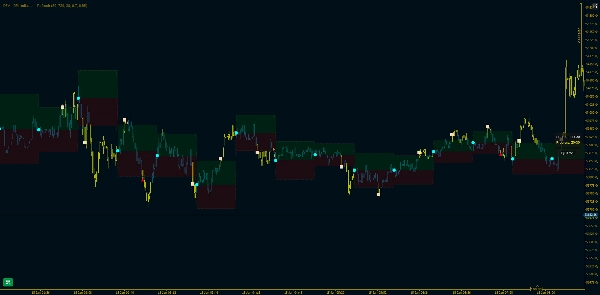
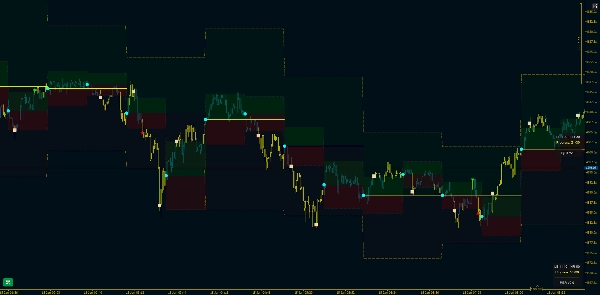
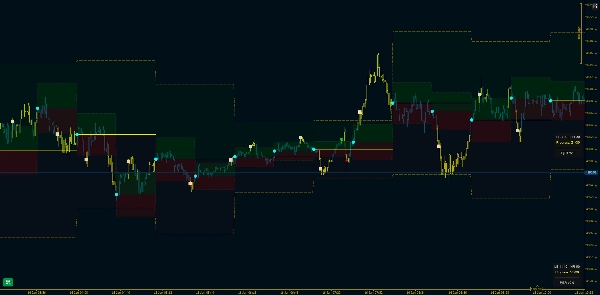
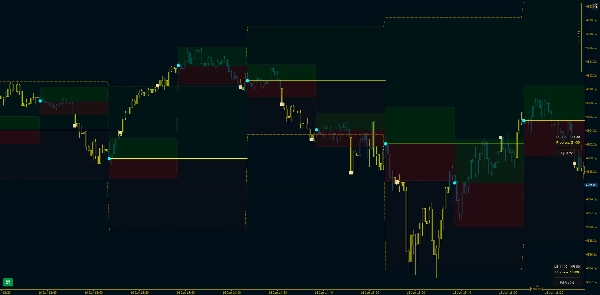
Ele analisa movimentos de preços passados para entender a volatilidade típica e cria Intervalos de Confiança - representando o intervalo de preço esperado. Quando o preço salta fora dessas bandas, sinaliza que algo anormal aconteceu.
Caso de Uso Alvo
Negociação intradiária (especialmente estratégias baseadas em faixa). Este indicador cria limites estatísticos ao redor do preço para detectar movimentos anormais. No comportamento normal do mercado, o preço permanece dentro dos intervalos esperados com base na volatilidade recente. Quando o preço rompe essas bandas, sinaliza que algo incomum está acontecendo - um possível ponto de saída de uma negociação ou uma ruptura na estrutura do mercado, porque o comportamento do mercado mudou.
Parâmetros Principais Explicados
Máximo de Dias Anteriores - Determina quão longe no histórico o indicador começa a funcionar
Deslocamento GMT - Ajusta para seu fuso horário. Garante que os cálculos de data correspondam ao seu horário local
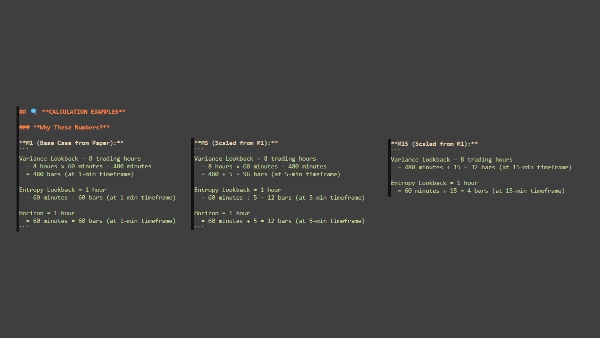
Período de Retrospectiva (barras)
"Quanto histórico de preço devo usar para medir o comportamento 'normal'?"
- Quantas barras de dados históricos usar para calcular a volatilidade
- Mais barras = mais estável, porém mais lento para se adaptar; menos barras = reação mais rápida, porém mais ruidosa
- Exemplo: 1440 barras em M1 = 24 horas de dados
Horizonte de Análise (barras)
"Por quanto tempo devo observar o preço antes de começar uma nova análise?"
- Duração de cada período de análise antes que as bandas sejam redefinidas
- Define o intervalo de tempo que você está analisando - mais curto = redefinições mais frequentes, mais longo = bandas permanecem fixas por mais tempo
- Exemplo: 60 barras = bandas permanecem por 60 barras, depois recalculam a partir do novo preço de referência
Probabilidade de Risco
"Quão certo quero estar de que o preço normalmente não atingirá esses níveis?"
- Define o nível de confiança para as bandas (como uma margem de segurança)
- Valores mais altos = bandas mais largas (menos sinais), valores mais baixos = bandas mais apertadas (mais sinais)
- Exemplo: 0.80 = 80% de confiança que o preço permanece dentro das bandas em condições normais
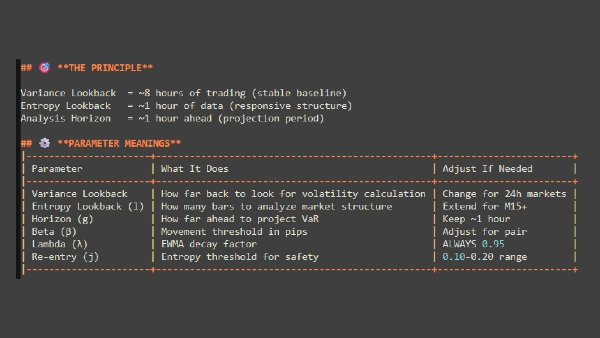
Fator de Decaimento (λ - Lambda)
"Devo me importar mais com o que acabou de acontecer ou tratar todo o histórico igualmente?"
- Controla quanto peso dar aos dados recentes versus dados antigos nos cálculos de volatilidade
- Valores mais altos = dados recentes importam mais; valores mais baixos = todos os dados têm peso mais igual
- Exemplo 0.95 = volatilidade recente influencia fortemente o cálculo
PONTOS IMPORTANTES A LEMBRAR
Esta é uma ferramenta de GESTÃO DE RISCO – Identifica eventos de volatilidade e estabilidade ao longo do tempo
Intervalos de Confiança são críticos – As bandas NÃO devem seguir o preço como o ATR – As bandas são calculadas para cada período de análise
A reentrada requer paciência – Não espere reentrada instantânea após a saída – O mercado precisa de tempo para se estabilizar
Parâmetros são específicos para ativo e período – Parâmetros padrão são pontos de partida – Otimize para seu mercado e estilo específicos – O que funciona em FX pode não funcionar para Índices, Metais ou Cripto.
( * ) Este indicador é fornecido apenas para fins educacionais e informativos. Não se destina a ser um conselho financeiro ou de investimento. Nada neste produto, sua documentação ou quaisquer materiais relacionados deve ser interpretado como uma recomendação para comprar, vender ou manter qualquer instrumento financeiro. Negociar nos mercados financeiros envolve riscos significativos e pode não ser adequado para todos os investidores. Desempenho passado não é indicativo de resultados futuros. Não há garantia de lucros, e os usuários podem incorrer em perdas substanciais. Ao usar este indicador, você reconhece que é o único responsável por suas próprias decisões de negociação e resultados financeiros. O criador deste produto não será responsabilizado por quaisquer perdas ou danos decorrentes direta ou indiretamente do seu uso. Sempre realize sua própria análise antes de tomar qualquer decisão de negociação.
Resumo
Key features include Value at Risk (VaR) estimates to anticipate potential losses, robustness against strong short-term trends, and analysis of post-jump corrections to identify safe re-entry timings. Core adjustable parameters allow users to tailor the indicator to specific assets and timeframes, including lookback period for volatility calculation, analysis horizon for band recalculation frequency, risk probability to set confidence levels, and decay factor to weight recent versus older data.
The indicator emphasizes patience for re-entry after exits, as market stabilization is required. It is intended as a tool for identifying volatility events and managing risk rather than providing direct trade signals. Users should optimize parameters according to their trading style and market conditions.
Avaliações de clientes
5 | 100 % | |
4 | 0 % | |
3 | 0 % | |
2 | 0 % | |
1 | 0 % |


