
Descrição
Amplitude Momentum Label — Detecção Adaptativa de Tendência Potencializada pela Volatilidade
O Amplitude Momentum Labeler unifica múltiplos conceitos avançados:
- Detecção de Regime — Identifica fases verdadeiras de tendência
- Adaptação à Volatilidade — Autoajuste às condições atuais do mercado
- VWAP Dinâmico — Destaca níveis significativos de retração e continuação
- Estimador de Spread Roll — Sinaliza pontos ótimos de reentrada durante tendências
- MÓDULO DE OTIMIZAÇÃO — com recurso de Auto-Otimização**
Isso cria um indicador inteligente e autoajustável que oferece clareza, adaptabilidade e zonas de negociação acionáveis—sem ajustes manuais constantes.
O Que É?
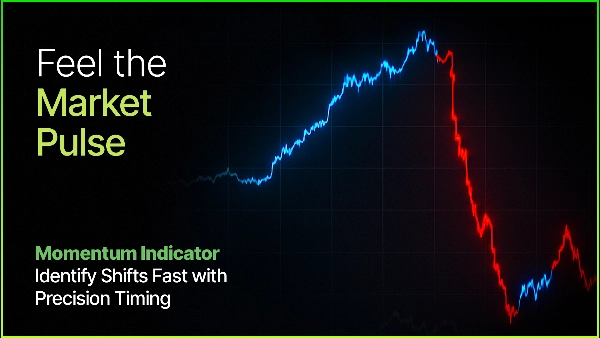
O Amplitude Momentum Labeler é um indicador de detecção de regime que identifica quando o mercado entra ou sai de fases de momentum ascendente ou descendente—em tempo real.
Ao contrário dos cruzamentos tradicionais de médias móveis, ele mede mudanças reais de momentum avaliando o deslocamento de preço e a força da reversão.
A Pergunta Central
O mercado está atualmente em uma fase de momentum—e em qual direção?
Para responder a isso, o indicador acompanha:
- Amplitude — o quanto o preço se moveu;
- Sequência — a ordem em que ocorrem máximas e mínimas.
Um movimento forte seguido por uma reversão significativa marca o início de um novo regime de momentum.
Como Funciona
1. Medir o Swing
O indicador atualiza constantemente os extremos de preço mais altos e mais baixos.
A diferença deles—amplitude—define o tamanho atual do swing do mercado.
2. Detectar Reversão
- Uma queda acentuada seguida por uma forte alta → **Momentum ascendente**
- Uma alta acentuada seguida por uma forte queda → **Momentum descendente**
3. Confirmar Significância
Somente reversões que excedem um limite ajustado pela volatilidade acionam um sinal válido.
4. Detectar Exaustão
Se o preço parar de progredir, o indicador identifica exaustão do momentum e retorna ao neutro.
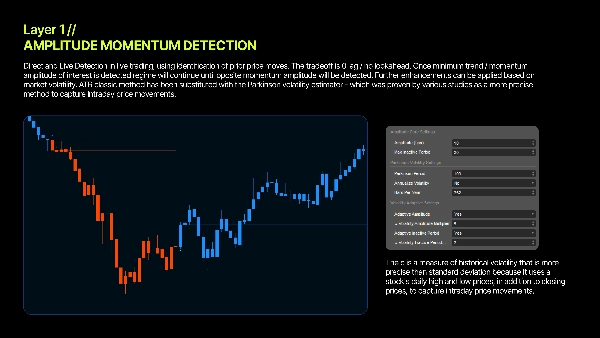
Volatilidade Parkinson — Limiares Adaptativos
A maioria dos indicadores usa parâmetros fixos. Este se adapta automaticamente. Usando Volatilidade Parkinson—que incorpora as faixas intradiárias de máxima/mínima—o indicador ajusta a sensibilidade com base nas condições reais do mercado. O resultado: desempenho consistente em ambientes calmos e voláteis. ( Estatisticamente comprovado como mais eficiente que o Método ATR )
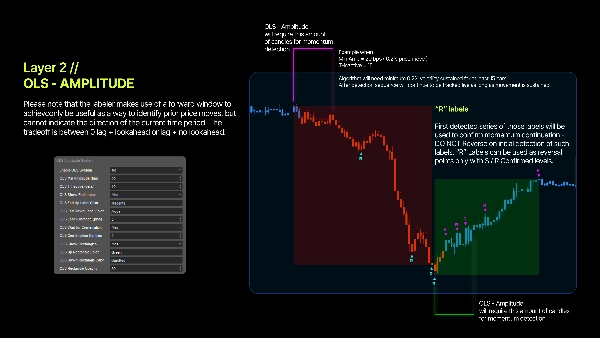
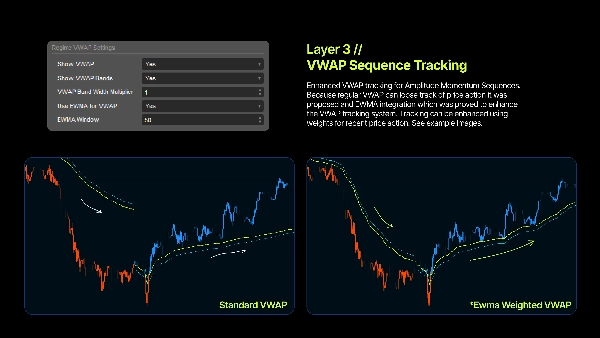
VWAP de Regime — Níveis Dinâmicos para Reentrada
Uma vez que um regime está ativo, o indicador calcula um VWAP específico para essa tendência, fornecendo Níveis Dinâmicos de Suporte e Resistência Dinâmica. Instituições dependem fortemente do VWAP, e o preço frequentemente reage ao seu redor—tornando-o ideal para entradas em retração.
Modo EWMA
Ative o EWMA para dar mais peso aos preços recentes, criando uma curva VWAP mais suave e responsiva. Excelente para identificar reentradas durante tendências prolongadas.
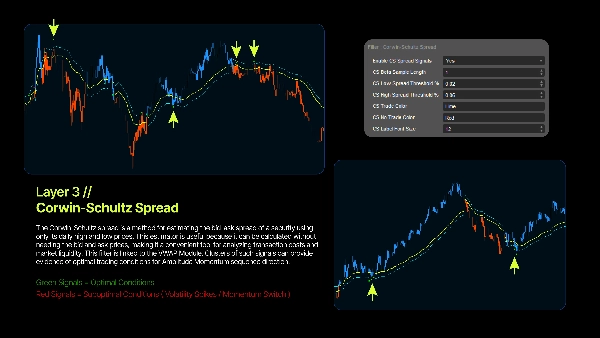
Estimador de Spread Roll - Filtro Dinâmico para Reentrada
Um estimador de spread roll é um método para estimar o spread bid-ask a partir dos preços observados nas negociações, tipicamente usando a covariância serial das mudanças de preço. Desenvolvido por Roll, assume que negociações sucessivas alternam entre os preços de bid e ask, e que novas informações não estão constantemente movendo o preço "verdadeiro". Embora simples e fundamental, o método original foi refinado para resolver problemas como viés para baixo e desempenho ruim em certos conjuntos de dados. O estimador baseia-se na ideia de que, se nenhuma nova informação for liberada, os preços simplesmente oscilarão entre o bid e o ask. Assume uma probabilidade igual de uma negociação iniciada por compra e uma iniciada por venda.
Benefícios do Uso
1. Identificação Objetiva de Tendência - Sem linhas de tendência. Sem suposições. A matemática define o regime.
2. Adaptação à Volatilidade - Ajusta-se automaticamente às condições mutáveis usando Volatilidade Parkinson.
3. Zonas Claras de Entrada - Níveis VWAP de regime ajudam a identificar áreas intuitivas para retração e adição.
4. Limites Definidos de Regime - Saiba exatamente quando o momentum começa e quando termina.
5. Compatibilidade Multi-Temporal - Normalização em pontos base garante comportamento consistente em qualquer gráfico.
A Base Quantitativa
Retornos Logarítmicos
Usar retornos logarítmicos garante simetria, tornando a medição de momentum matematicamente robusta.
Pontos Base
Todos os cálculos usam unidades padronizadas em bps (1 bps = 0,01%), permitindo consistência entre ativos.
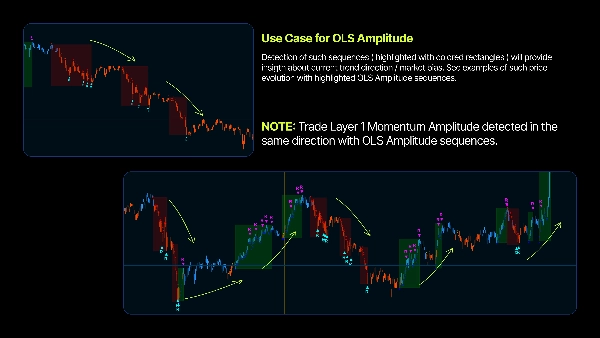
Detecção de Retração
Mudanças de momentum são identificadas por movimentos direcionais fortes seguidos por contra-movimentos significativos (reversões em V).
Volume Sintético
Volume sintético baseado em faixa e corpo garante precisão do VWAP para qualquer símbolo.
⎽⎽⎽⎽⎽⎽⎽⎽⎽⎽⎽⎽⎽⎽⎽⎽⎽⎽⎽⎽⎽⎽⎽⎽⎽⎽⎽⎽⎽⎽⎽⎽⎽⎽⎽⎽⎽⎽⎽⎽⎽⎽⎽⎽⎽⎽⎽⎽⎽⎽⎽⎽⎽⎽⎽⎽⎽⎽⎽⎽⎽⎽⎽⎽⎽⎽⎽⎽⎽⎽⎽⎽⎽⎽⎽⎽⎽⎽⎽⎽⎽⎽⎽⎽⎽⎽⎽⎽⎽⎽⎽⎽⎽⎽⎽⎽⎽⎽⎽⎽⎽⎽⎽⎽⎽⎽⎽⎽⎽⎽⎽⎽⎽
Esta ferramenta é apenas para fins educacionais e informativos. Não constitui aconselhamento de investimento. Negociar envolve riscos, e perdas podem exceder depósitos. Desempenho passado não garante resultados futuros. Você é o único responsável por todas as decisões de negociação. O criador não se responsabiliza por quaisquer perdas financeiras decorrentes do uso do indicador. Sempre realize sua própria análise antes de negociar.
Resumo
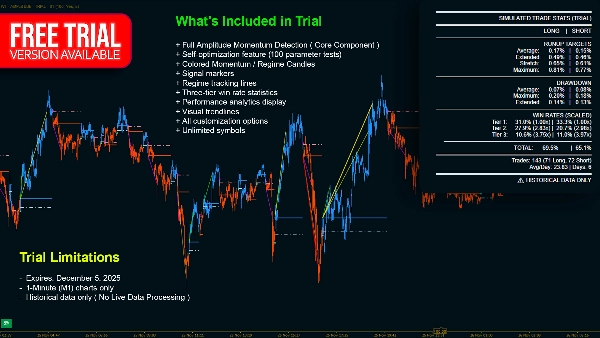
Key features include:
- **Regime Detection:** Pinpoints market entry and exit points for momentum trends.
- **Volatility Adaptation:** Uses Parkinson Volatility to self-tune sensitivity based on current market conditions, ensuring consistent performance across varying volatility.
- **Dynamic VWAP:** Calculates a volume-weighted average price specific to each trend regime, providing dynamic support and resistance levels for pullback and continuation entries.
- **Roll Spread Estimator:** Estimates bid-ask spreads to signal optimal re-entry points during trends.
- **Self-Optimization Module:** Automatically adjusts parameters without manual intervention.
The indicator operates by continuously tracking price extremes to measure swing amplitude, detecting significant reversals that exceed volatility-adjusted thresholds, and identifying momentum exhaustion when price progression stalls. It uses logarithmic returns and basis-point normalization for mathematically robust, cross-asset consistency. Synthetic volume calculations enhance VWAP accuracy across symbols.
This tool supports multiple markets including Forex, stocks, indices, commodities, and cryptocurrencies, and is compatible with various timeframes. It outputs visual signals and filters to assist traders in objective trend identification and clear entry zone determination.
Avaliações de clientes
5 | 75 % | |
4 | 25 % | |
3 | 0 % | |
2 | 0 % | |
1 | 0 % |


![Logótipo de "[Hamster-Coder] Pivot Points MTF"](https://cdn.ctrader.com/image/webp/4c143e5a-309c-40e3-a578-f04d1e133ffa_31159)
