説明
Bounty Killa – 大口投資家が行う前にストップロスの流動性を狩るインジケーター。
Bounty Killaは、ストップハント/流動性の奪取を好んで取引するトレーダー向けに設計されたcTraderインジケーターです:高値を超えたり安値を下回ったりしてストップを一掃し、その後逆方向に反転するローソク足のことです。
インジケーターは自動的にすべてのローソク足をスキャンし、以下を示します:
- SHS (Stop Hunt High) – 最近の高値を超えた可能性のあるストップハント → ショートセットアップを探すエリア
- SHL (Stop Hunt Low) – 最近の安値を下回った可能性のあるストップハント → ロングセットアップを探すエリア
検出ロジックは以下に基づいています:
- 最近の高値/安値を少なくともXピップス以上突破すること、
- そのレベルを超えて伸びる長いヒゲ、
- 小さな実体とブレイクアウトの逆方向での終値。
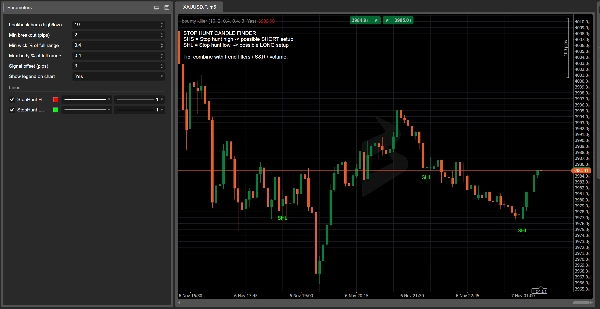
「これはストップハントかも?」と推測する必要はもうありません:Bounty Killaはチャート上に重要なローソク足を直接ハイライトし、明確なラベル、色、チャート上の凡例を表示します。
トレーダーに好まれる理由:
- 市場がどこで流動性を奪ったか、そして反転がより意味を持つ場所を示します。
- 完全にカスタマイズ可能:遡るバー数、最小ブレイクアウト幅(ピップス)、実体/ヒゲの割合、シグナルのオフセット。
- 古典的なサポート/レジスタンス、需給、出来高、オーダーブロック、SMCコンセプトと完璧に組み合わせ可能。
- 流動性ベースのセットアップを追うトレーダーに最適で、客観的かつルールベースのものを求める方に。
⚠️ Bounty Killaは完全なトレーディングシステムではなく、取引の開始や終了は行いません。
マークされたローソク足は高情報ゾーンであり、ご自身の戦略、トレンド分析、リスク管理と統合する必要があります。
Bounty Killa – クイックユーザーガイド(EN)
1. 推奨市場&時間足
- 時間足: H1、H4、D1
(M1〜M5などの低い時間足はノイズが多いため、主に学習用に使用してください。) - シンボル: インデックス、FX、暗号通貨、株式、商品 – cTraderインジケーターを適用できるすべての場所。
2. シグナルの読み方
- SHS – Stop Hunt High(ローソク足の上に赤いラベル)
-
- 価格が最近の高値を超え、長い上ヒゲを作り、ベアクローズします。
- アイデア:偽のブレイクアウトと高値上の流動性奪取後のショートセットアップの可能性。
- SHL – Stop Hunt Low(ローソク足の下に緑のラベル)
-
- 価格が最近の安値を下回り、長い下ヒゲを作り、ブルクローズします。
- アイデア:偽のブレイクダウンと安値下の流動性奪取後のロングセットアップの可能性。
Bounty Killerは「今すぐ買え/売れ」とは言いません。
反転がより意味を持つ流動性ゾーンをハイライトします。
3. 推奨基本設定
インジケーターのパラメーター内で:
- 遡るバー数(高値/安値):
10–20
→ 最近の高値/安値を探すバー数。 - 最小ブレイクアウト(ピップス):
5–15ピップス
→ ストップハントとカウントするための高値/安値を超える最小距離。 - 全範囲に対する最小ヒゲ割合:
0.60–0.70
→ ローソク足の少なくとも60〜70%がストップハント方向のヒゲである必要があります。 - 全範囲に対する最大実体割合:
0.25–0.35
→ ローソク足全体の範囲に比べて小さな実体。 - シグナルオフセット(ピップス):
3–5
→ 視覚的なもので、SHS/SHLラベルをローソク足から少し離して表示します。
4. シンプルな例の戦略
トレンドフィルター(EMA 200):
- チャートに200 EMAを追加します。
- ショートのみ:
-
- 価格がEMA 200の下にある。
- SHSシグナル(ストップハント高値)を受け取る。
- ロングのみ:
-
- 価格がEMA 200の上にある。
- SHLシグナル(ストップハント安値)を受け取る。
エントリーアイデア:
- ストップハントローソク足のクローズを待つ。
- 次のローソク足で価格が確認した場合のみエントリー:
-
- SHSの場合:次のローソク足がSHSローソク足の安値を割る→ ショートを検討。
- SHLの場合:次のローソク足がSHLローソク足の高値を超える→ ロングを検討。
ストップロス:
- SHS(ショート)の場合 → SHSローソク足の高値のすぐ上にSL。
- SHL(ロング)の場合 → SHLローソク足の安値のすぐ下にSL。
テイクプロフィット:
- 少なくとも1:1.5または1:2のリスクリワードを目指す、または
- 近くのスイング高値/安値、サポート/レジスタンス、需給ゾーンをターゲットにする。
5. 安全上の注意&クイックチェックリスト
Bounty Killerのシグナルを使う前に、以下を確認してください:
- トレンド?
シグナルは全体のトレンド(EMA 200/市場構造)と一致していますか? - レベル?
ストップハントは意味のあるレベル(前回の高値/安値、S/R、セッションの高値/安値など)で起きていますか? - コンテキスト?
ニュース、セッションの開始/終了、ボラティリティの急増はありますか? - リスク?
あなたの資金管理(取引ごとの最大%)に対してストップサイズは適切ですか?
これらのポイントのうち3〜4が揃っている場合、Bounty KillaのSHS/SHLは単なる「良いローソク足」ではなく、高価値ゾーンとしてトレードアイデアの基盤になります。
概要
The detection criteria include a breakout beyond recent highs/lows by a configurable number of pips, a long wick extending beyond that level, a small candle body, and a close opposite to the breakout direction. Signals are displayed directly on the chart with clear labels and colors, supported by an on-chart legend.
Recommended for use on hourly to daily timeframes (H1, H4, D1) across various markets including forex, indices, cryptocurrencies, stocks, and commodities, Bounty Killa is fully customizable with parameters such as lookback period, minimum breakout size, wick and body proportions, and signal label offset.
The indicator highlights high-value liquidity zones to support trading decisions but does not execute trades. It is intended to be combined with other analysis tools like support/resistance, volume, order blocks, and trend filters (e.g., 200 EMA) for developing objective, rule-based liquidity-based trading setups.
カスタマーレビュー
5 | 50 % | |
4 | 50 % | |
3 | 0 % | |
2 | 0 % | |
1 | 0 % |


