
Descrição
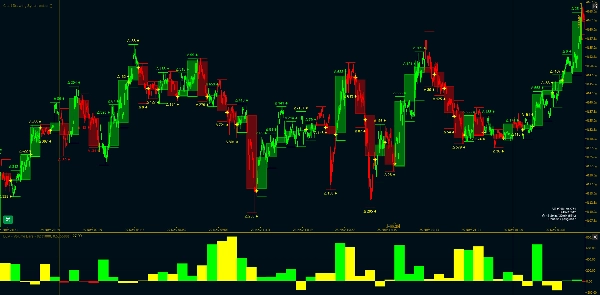
Barras de Volume por Tick é um método de amostragem de barras orientado por informações que cria barras com base no volume acumulado atingindo um limite adaptativo. Ao contrário das barras baseadas no tempo, as Barras de Volume ajustam-se aos níveis de atividade do mercado usando medições em tempo real do desequilíbrio do fluxo.
Melhor Para: Traders que se preocupam com a participação total e a distribuição de volume.
Métrica Principal: Volume por Tick (V) - Atividade total do mercado
Versão 1.0
Use a seção de comentários para pedir mais detalhes
Disponível para sessão em vídeo com guia de configuração após a compra
----------------------------------------------------------------------------------------------------------------------------------------
Conceito Principal
----------------------------------------------------------------------------------------------------------------------------------------
Barras Tradicionais Baseadas no Tempo: Intervalos fixos (1 min, 5 min, etc.)
- Problema: A atividade do mercado varia dramaticamente
- O mesmo período de tempo pode conter 10 ticks ou 10.000 ticks
Barras de Volume: Intervalos variáveis baseados no Volume
- Solução: As barras se completam quando o volume suficiente é acumulado
- Adapta-se à atividade do mercado usando limite EWMA
----------------------------------------------------------------------------------------------------------------------------------------
Estrutura Matemática
----------------------------------------------------------------------------------------------------------------------------------------
1. Classificação do Tick (Regra do Tick) - Cada tick é classificado como compra ou venda com base no movimento do preço.
2. Proporção de Compra EWMA - Acompanha a proporção corrente de ticks de compra usando ponderação exponencial.
3. Cálculo do Limite Adaptativo - O limite ajusta-se com base na direção dominante do fluxo.
4. Acumulação de Volume - Acompanha os volumes acumulados de compra e venda.
5. Condição de Conclusão da Barra - Uma barra se completa quando o volume acumulado atinge o limite adaptativo.
6. Cálculo do Delta - O delta mede o desequilíbrio do fluxo de ordens.
----------------------------------------------------------------------------------------------------------------------------------------
Referência de Parâmetros
----------------------------------------------------------------------------------------------------------------------------------------
Configurações Principais
- Tamanho Esperado da Barra E[T]: Volume alvo por barra
- Alpha EWMA: Fator de suavização
Modo de Reserva
- Usar Reserva Baseada no Tempo: Ativa barras baseadas no tempo (ativa amostragem de dados de volume baseada em intervalos de tempo fixos)
- Minutos de Reserva: Intervalo de tempo personalizado para amostragem de dados
Reinício Diário
- Reinício Diário: Ativa o reinício dos cálculos de amostragem de volume para cada novo dia/sessão
- Hora do Reinício: Hora para reinício
- Minuto do Reinício: Minuto para reinício
- Deslocamento GMT: Deslocamento do fuso horário
Filtro de Volume
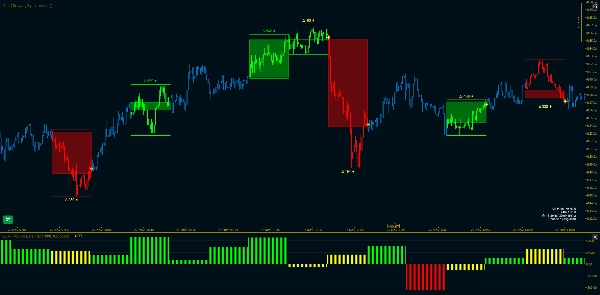
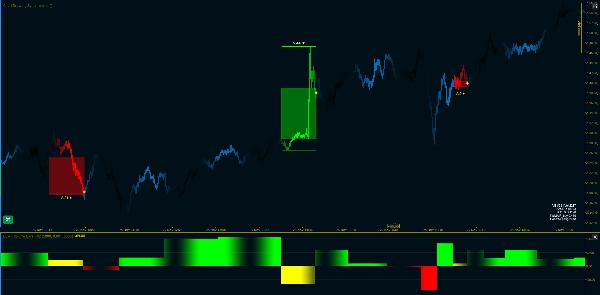
- Ativar Filtro de Volume: Alternar filtragem - o indicador exibirá apenas Barras de Volume Filtradas
- Volume Mínimo: Limite mínimo de volume
Configurações Visuais
- Mostrar Rótulos das Barras de Volume: Alternar rótulos
- Mostrar Marcadores de Divergência: Alternar marcadores de divergência
- Colorir Velas do Gráfico: Alternar coloração do gráfico
- Transparência da Barra: Transparência OHLC das Barras de Volume
- Cores de Alta/Baixa: Cores das Barras de Volume
----------------------------------------------------------------------------------------------------------------------------------------
Referências
----------------------------------------------------------------------------------------------------------------------------------------
- López de Prado, M. - Avanços em Aprendizado de Máquina Financeiro
- Capítulo sobre "Barras Orientadas por Informação"
Resumo
Key features include:
- Adaptive bar intervals based on volume rather than fixed time periods
- EWMA smoothing for threshold adjustment reflecting dominant market flow
- Optional fallback to time-based bars with customizable intervals
- Daily reset of volume sampling calculations with configurable reset time and timezone offset
- Volume filtering to display bars exceeding a minimum volume threshold
- Visual customization options such as volume bar labels, divergence markers, candle coloring, transparency, and color schemes for bullish/bearish bars
The indicator is designed for traders focused on total market participation and volume distribution across Forex, commodities, indices, and cryptocurrencies. It incorporates concepts from financial machine learning literature on information-driven bars.
Avaliações de clientes
5 | 100 % | |
4 | 0 % | |
3 | 0 % | |
2 | 0 % | |
1 | 0 % |


