
説明
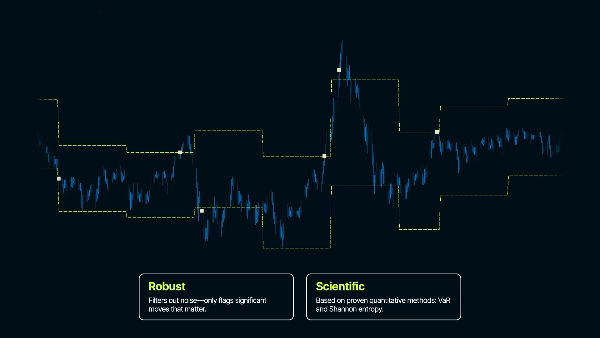
Price Jump Exit and Re-entry (PjER ) Indicator は、学術論文に基づくリスク管理指標です「Koegelenberg & van Vuuren (2024)による「A dynamic price jump exit and reentry strategy for intraday trading」、Expert Systems With Applications Journalに掲載」
主な革新点
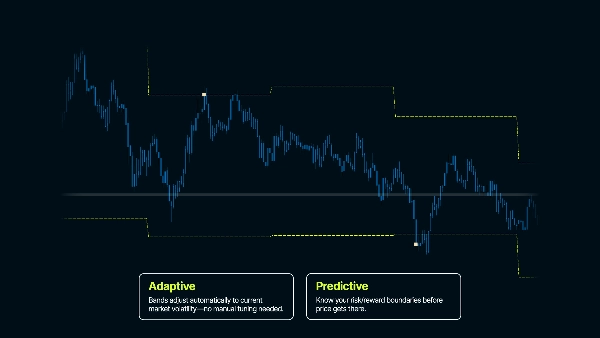
- 発生前の潜在的損失のVaR推定
- 短期間の強い市場トレンドに対する堅牢性
- ジャンプ後の市場調整分析による安全な再エントリータイミング
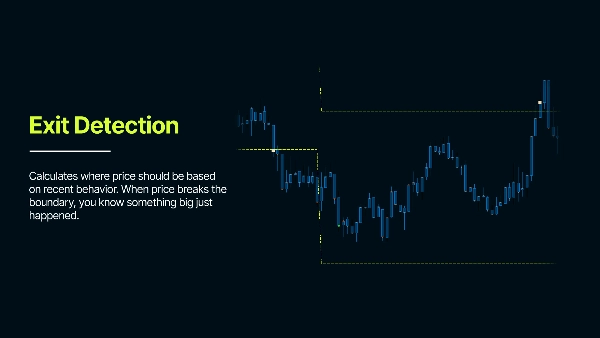
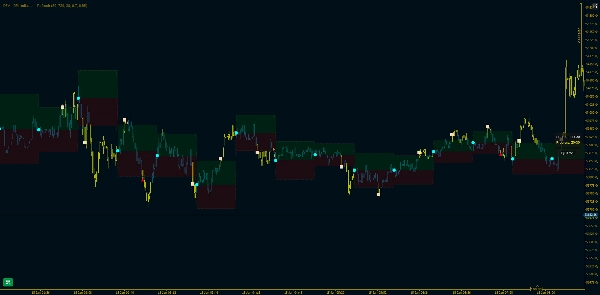
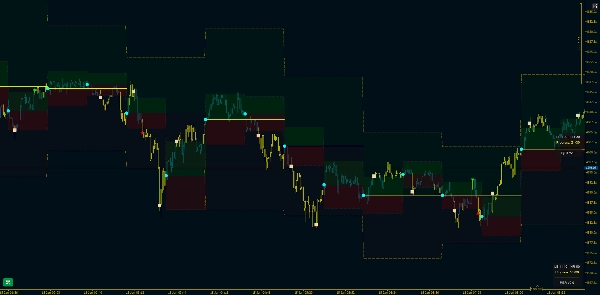
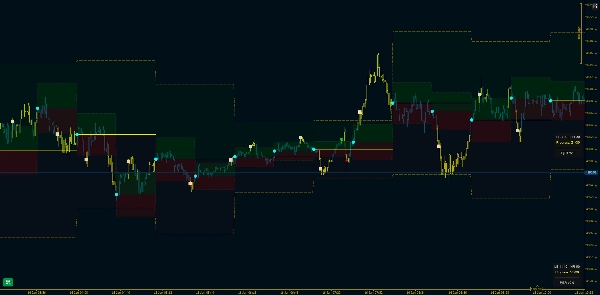
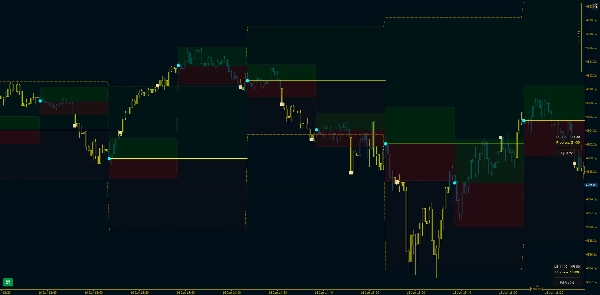
過去の価格変動を分析して典型的なボラティリティを理解し、期待される価格範囲を表す信頼区間を作成します。価格がこれらのバンドの外にジャンプすると、異常な事象が発生したことを示します。
対象ユースケース
日中取引(特にレンジベースの戦略)。この指標は価格の周りに統計的境界を作成し、異常な価格変動を検出します。通常の市場行動では、価格は最近のボラティリティに基づく期待範囲内に留まります。価格がこれらのバンドを突破すると、市場構造のブレイクアウトや取引からの潜在的な退出ポイントを示し、市場行動が変化したことを示します。
主要パラメータの説明
最大遡及日数 - 指標が動作を開始する履歴の範囲を決定します
GMTオフセット - タイムゾーンを調整します。日付計算がローカル時間と一致するようにします
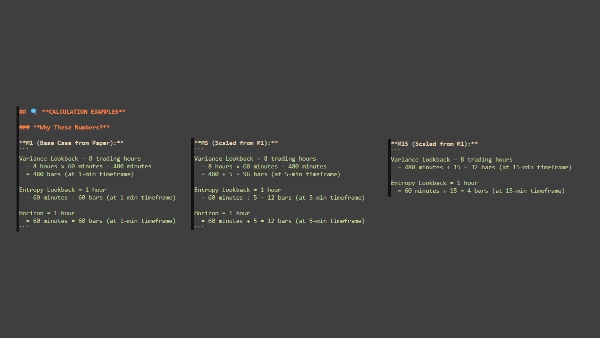
遡及期間(バー数)
「「通常の」行動を測定するためにどれだけの価格履歴を使うべきか?」
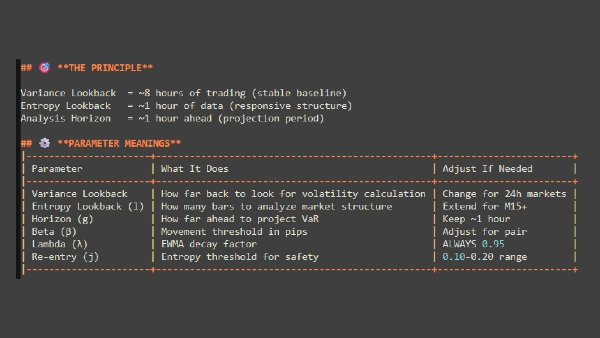
- ボラティリティ計算に使用する履歴データのバー数
- バー数が多いほど安定するが適応が遅く、バー数が少ないほど反応は速いがノイズが多い
- 例:M1で1440バー = 24時間分のデータ
分析期間(バー数)
「どれくらいの期間価格を観察してから新たに開始すべきか?」
- バンドがリセットされる前の各分析期間の長さ
- 分析している時間枠を設定 - 短いほどリセット頻度が高く、長いほどバンドが長く固定される
- 例:60バー = バンドは60バーの間維持され、その後新しい基準価格から再計算される
リスク確率
「価格が通常これらのレベルに達しないとどれだけ確信したいか?」
- バンドの信頼レベルを設定(安全マージンのようなもの)
- 値が高いほどバンドは広く(シグナルは少なく)、値が低いほどバンドは狭く(シグナルは多い)
- 例: 0.80 = 通常条件下で価格がバンド内に留まる80%の信頼度
減衰係数(λ - ラムダ)
「直近の出来事をより重視すべきか、それとも全履歴を均等に扱うべきか?」
- ボラティリティ計算における最近のデータと古いデータの重み付けを制御
- 値が高いほど最近のデータが重要視され、値が低いほど全データが均等に重み付けされる
- 例 0.95 = 最近のボラティリティが計算に強く影響する
覚えておくべき重要ポイント
これはリスク管理ツールです – ボラティリティのイベントと期間中の安定性を識別します
信頼区間が重要です – バンドはATRのように価格に追随してはいけません – バンドは各分析期間ごとに計算されます
再エントリーには忍耐が必要です – 退出後すぐの再エントリーは期待しないでください – 市場は安定する時間が必要です
パラメータは資産と時間枠に特有です – デフォルトパラメータは出発点です – 特定の市場とスタイルに最適化してください – FXで機能するものが指数、金属、暗号通貨では機能しない場合があります。
( * ) この指標は教育および情報提供のみを目的としています。金融または投資アドバイスを意図したものではありません。本製品、そのドキュメント、または関連資料のいかなる内容も、金融商品を購入、売却、保有する推奨と解釈されるべきではありません。金融市場での取引は重大なリスクを伴い、すべての投資家に適しているわけではありません。過去のパフォーマンスは将来の結果を保証するものではありません。利益の保証はなく、ユーザーは大きな損失を被る可能性があります。この指標を使用することで、ユーザーは自身の取引判断および財務結果に対して単独で責任を負うことを認めます。本製品の作成者は、その使用に起因または関連する損失や損害について一切の責任を負いません。取引判断を行う前に必ず自身で分析を行ってください。
概要
Key features include Value at Risk (VaR) estimates to anticipate potential losses, robustness against strong short-term trends, and analysis of post-jump corrections to identify safe re-entry timings. Core adjustable parameters allow users to tailor the indicator to specific assets and timeframes, including lookback period for volatility calculation, analysis horizon for band recalculation frequency, risk probability to set confidence levels, and decay factor to weight recent versus older data.
The indicator emphasizes patience for re-entry after exits, as market stabilization is required. It is intended as a tool for identifying volatility events and managing risk rather than providing direct trade signals. Users should optimize parameters according to their trading style and market conditions.
カスタマーレビュー
5 | 100 % | |
4 | 0 % | |
3 | 0 % | |
2 | 0 % | |
1 | 0 % |


