
Opis
🌐 DOMINUJ NA RYNKU DZIĘKI ODCZYTOWI PRZEPŁYWU INSTYTUCJONALNEGO
Co pokazuje: faktycznie zrealizowane transakcje — prawdziwy przepływ agresji.
Zalety: Ten wskaźnik opiera się na danych tickowych.
Reprezentuje pieniądze, które zostały już zaangażowane na rynku.
Klasyfikuje agresorów (kupujący/sprzedający trafiający na ask/bid).
Wykrywa absorpcję, wyczerpanie, przyspieszenie przepływu.
📈 Połącz z darmowymi wskaźnikami, wolumenem przy cenie, kompresorem wolumenu.
https://ctrader.com/products/2514 https://ctrader.com/products/2874
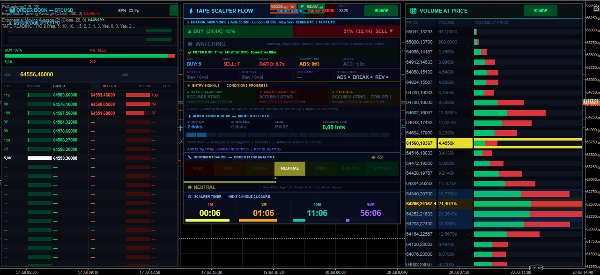
Order Flow
Tape Reading
Ladder DOM
Instytucjonalna absorpcja
Inteligentne wybicia
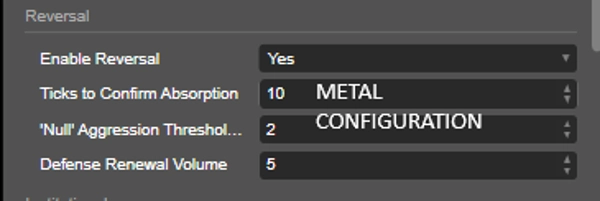
Odwrócenia przepływu
Presja kupna i sprzedaży
Analiza agresji w czasie rzeczywistym
System przekształca tradycyjny wykres w prawdziwe centrum odczytu rynku instytucjonalnego.
RÓŻNICA ALGORITMU
Podczas gdy zwykłe wskaźniki analizują tylko świece, Tape Reading Scalper interpretuje:
✅ Prawdziwą agresję kupujących i sprzedających
✅ Prędkość przepływu
✅ Obrona instytucjonalna
✅ Absorpcja zleceń
✅ Przyspieszenie drabinki
✅ Wybicia potwierdzone przez przepływ
✅ Odwrócenia przez wyczerpanie
✅ Presja instytucjonalna vs. detaliczna
✅ Inteligentne skalowanie lotów
STRUKTURA SYSTEMU
Algorytm posiada 2 niezależne profesjonalne panele:
⚡ PANEL PRZEPŁYWU (OKNO 1)
Panel odpowiedzialny za operacyjny odczyt i generowanie sygnałów.
Wyświetla:
Przepływ kupujących/sprzedających
Absorpcję
Odwrócenie
Wybicie
Serię agresji
Sesje rynkowe
Wskaźnik kupna/sprzedaży
Przyspieszenie drabinki
Dynamiczne SL/TP
Filtry operacyjne
📊 PANEL DRABINKI (OKNO 2)
Panel instytucjonalny skupiony na:
Drabinka DOM
Poziomy instytucjonalne
Wolumen według ceny
Presja instytucjonalna
POC
Zasięg
Dzienne i tygodniowe maksimum/minimum
Księga cen
Instytucjonalne ciepło
WYJAŚNIENIE FUNKCJI DRABINKI
1. AGRESJA KUPUJĄCYCH
Pokazuje aktualną agresję kupujących.
Gdy szybko rośnie:
Kupujący wchodzą mocno. Rynek może przyspieszyć w górę. Wskazuje na możliwe wybicie.
Im wyższa liczba:
➡ większa presja kupna.
2. AGRESJA SPRZEDAJĄCYCH
Pokazuje agresję sprzedających.
Gdy szybko rośnie:
Sprzedający dominują
Możliwa kontynuacja spadku
Instytucjonalne wejście na krótko
3. WSKAŹNIK KUPNA/SPRZEDAŻY
Pokazuje relację między kupującymi a sprzedającymi.
Przykład:
Wskaźnik 2.0x = dominują kupujący
Wskaźnik 3.0x = silna presja instytucjonalna
Wskaźnik poniżej 1.0 = dominują sprzedający
Interpretacja:
Interpretacja wskaźnika
1.0 Równowaga
1.5 Umiarkowana presja
2.0+ Silny trend
3.0+ Silny przepływ instytucjonalny
4. ABSORPCJA
Jedna z najsilniejszych funkcji algorytmu.
System wykrywa, gdy:
Występuje duży agresywny wolumen
Ale cena się NIE porusza
To oznacza:
➡ Inwestorzy instytucjonalni absorbują zlecenia.
ABSORPCJA KUPUJĄCYCH
Rynek otrzymuje dużo sprzedaży, ale:
Cena przestaje spadać. Pojawia się obrona instytucjonalna. Możliwe odwrócenie na kupno.
Sygnał:
▲ ABSORPCJA KUPUJĄCYCH
ABSORPCJA SPRZEDAJĄCYCH
Rynek otrzymuje dużo kupna, ale:
Cena nie rośnie. Sprzedający powstrzymują ruch. Możliwe odwrócenie na sprzedaż.
Sygnał:
▼ ABSORPCJA SPRZEDAJĄCYCH
5. PRZYSPIESZENIE DRABINKI
Mierzy prędkość przepływu w DOM.
Algorytm porównuje:
Ostatni przepływ
z poprzednim przepływem
Gdy przyspiesza:
➡ Prawdopodobne wejście instytucjonalne.
Przykład:
Wartość Znaczenie
1.0x Normalny przepływ
1.5x Silne przyspieszenie
2.0x+ Eksplozja instytucjonalna
6. WYKRYWANIE WYBIĆ
Wykrywa prawdziwe wybicia.
System weryfikuje:
✅ Wolumen
✅ Agresję
✅ Prędkość
✅ Serię
✅ Przepływ instytucjonalny
✅ Przyspieszenie drabinki
WYBICIE KUPNA
Warunki:
Silna agresja kupna Przyspieszenie drabinki Presja instytucjonalna Wybicie maksimum
Wynik:
➡ Zweryfikowane wejście na kupno.
WYBICIE SPRZEDAŻY
Warunki:
Silna presja sprzedaży Sprzedażowy przepływ instytucjonalny Wybicie wsparcia
Wynik:
➡ Potwierdzona sprzedaż.
7. WYKRYWANIE ODWRÓCEŃ
Wykrywa odwrócenia spowodowane wyczerpaniem.
System identyfikuje:
Zanik agresji Pojawienie się obrony instytucjonalnej Utrata siły trendu
Wynik:
➡ Przewidywane odwrócenie.
8. SYSTEM SERII
Inteligentny system ciągłości przepływu.
Liczy, ile kolejnych ticków wystąpiło:
Ciągły kupno
lub
Ciągła sprzedaż
POZIOMY SERII
Poziom Znaczenie
Poziom 1 Początkowy trend
Poziom 2 Silny przepływ
Poziom 3 Eksplozywny ruch
9. SUGEROWANE LOTY
Algorytm automatycznie sugeruje:
zwiększoną wielkość lota
zmniejszone ryzyko
skalę operacyjną
Na podstawie:
✅ Siły przepływu
✅ Ciągłości
✅ Intensywności instytucjonalnej
11. POC (PUNKT KONTROLNY)
Pokazuje cenę z najwyższym wolumenem obrotu.
Znaczenie:
Silne wsparcie/opór
Strefa instytucjonalna
Region obrony
12. POZIOMY DZIENNE/TYGODNIOWE
Automatyczne linie dla:
Dziennego maksimum
Dziennego minimum
Tygodniowego maksimum
Tygodniowego minimum
Używane do:
✅ Wybić
✅ Odwróceń
✅ Płynności
✅ Zleceń stop-loss
13. FILTR INSTYTUCJONALNY
Zaawansowany filtr instytucjonalny.
Różnica:
Przepływ detaliczny
vs Przepływ instytucjonalny
System weryfikuje:
✅ Klastry instytucjonalne
✅ Wolumen na poziom
✅ Dominująca presja
📈Używaj tego wskaźnika jako potwierdzenia wejścia do swojej strategii. Warto podkreślić znaczenie analizy przepływu, sygnałów absorpcji, prędkości taśmy i agresji w tickach oraz sentymentu.
Podsumowanie
Key functionalities include detection of institutional absorption (when large volume does not move price), breakout validation through volume and flow speed, reversal anticipation by exhaustion signals, and an intelligent streak system counting consecutive buy or sell ticks. The indicator also suggests lot sizing based on flow strength and institutional intensity, and applies an institutional filter distinguishing retail versus institutional flow.
Tape Reading 4.2 supports analysis of key market levels, real-time aggression, and flow reversals, transforming traditional charts into comprehensive institutional market reading tools. It is suitable for traders seeking detailed order flow insights and confirmation signals for entries based on market microstructure and volume dynamics.
Opinie klientów
5 | 50 % | |
4 | 50 % | |
3 | 0 % | |
2 | 0 % | |
1 | 0 % |


