Opis
Główny cel:
Mapowanie rozkładu wolumenu według poziomu cenowego w celu identyfikacji:
Obszarów o wysokiej płynności
Obszarów o niskiej płynności
Nierówności między kupującymi a sprzedającymi
Ten wskaźnik jest potężnym narzędziem do zrozumienia struktury rynku i identyfikacji obszarów o wysokim prawdopodobieństwie operacji! 🎯
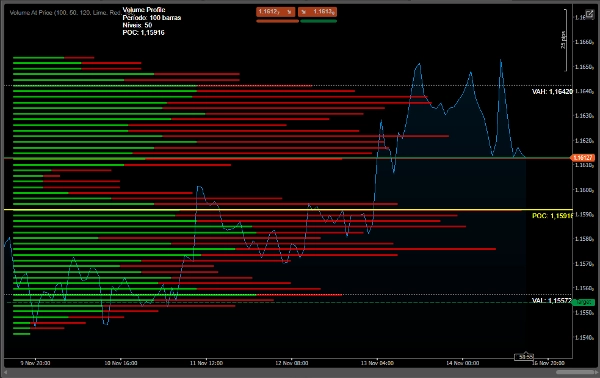
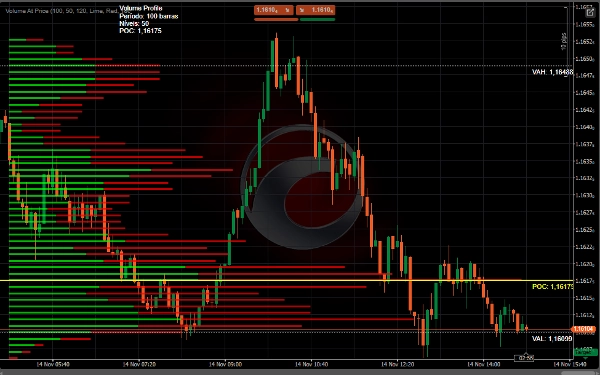
1. POC (Punkt Kontroli)
Linha Amarela - Cena z najwyższym wolumenem obrotu
Obszar największej płynności i ceny
Naturalne wsparcie/opór
2. Obszar wartości
Białe linie - Obszar, w którym zrealizowano 70% wolumenu
VAH (Value Area High) - Górna granica
VAL (Value Area Low) - Dolna granica
Strefa równowagi rynku
3. Rdzenie wolumenu
🟢 Zielony - Dominujący wolumen kupna
🔴 Czerwony - Dominujący wolumen sprzedaży
Długość słupka = Intensywność wolumenu
📊 Strategie wykorzystania
1. Identyfikacja wsparć i oporów
• POC działa jako dynamiczne wsparcie/opór
• Obszar wartości definiuje strefę równowagi
• Ważne krawędzie profilu S/R
2. Analiza wybicia
• Przebicie powyżej VAH → Trend wzrostowy
• Przebicie poniżej VAL → Trend spadkowy
• Wolumen bez przebicia potwierdza ruch
3. Punkty wejścia
• Kupno: Retest VAL z wolumenem kupujących
• Sprzedaż: Retest VAH z wolumenem sprzedających
• Fade: Operowanie przeciwko ekstremom profilu
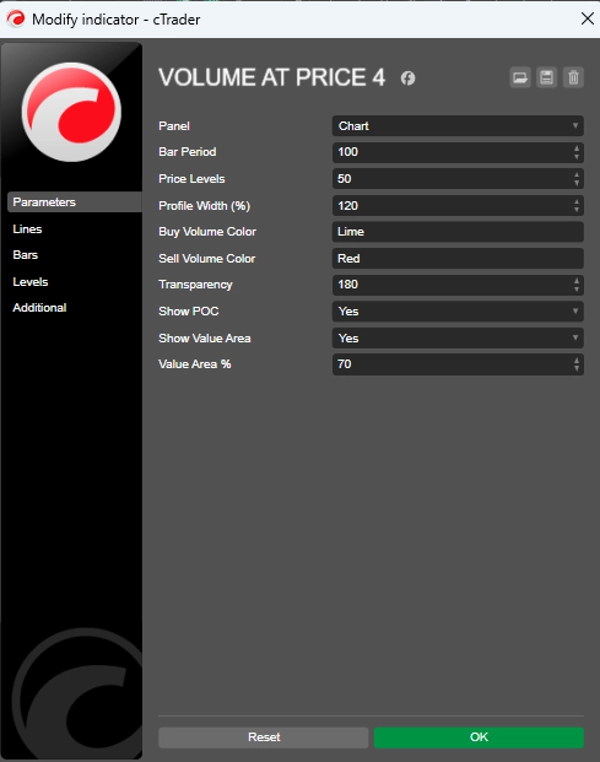
⚙️ Zalecane ustawienia
Dla Day Tradingu
csharp
Okres = 50-100
Poziomy cenowe = 50
Szerokość profilu = 120%
Procent obszaru wartości = 70
Dla Swing Tradingu
csharp
Okres = 100-200
Poziomy cenowe = 80
Szerokość profilu = 150%
Procent obszaru wartości = 70
✅ ZALETY:
Identyfikuje dynamiczne wsparcia/opory
Pokazuje intencje rynku (wolumen)
Ujawnia ważne obszary płynności
Wyraźna wizualizacja nierówności
Liczenie aktualnych ticków wolumenu
Podsumowanie
- Point of Control (POC): The price level with the highest traded volume, acting as a dynamic support or resistance.
- Value Area: The price range where 70% of volume is traded, defined by Value Area High (VAH) and Value Area Low (VAL), representing market balance zones.
- Volume Cores: Colored bars indicating dominant buying (green) or selling (red) volume, with bar length reflecting volume intensity.
The indicator supports strategies like identifying support and resistance levels, breakout analysis (trend direction based on VAH and VAL breaks), and entry points (buy near VAL with buyer volume, sell near VAH with seller volume, or fade at profile extremes).
Recommended settings vary by trading style: for day trading, shorter periods and narrower profiles; for swing trading, longer periods and wider profiles. This tool aids in visualizing liquidity, market intent, and volume imbalances to inform trading decisions.
Opinie klientów
5 | 0 % | |
4 | 50 % | |
3 | 50 % | |
2 | 0 % | |
1 | 0 % |