

Opis
VOLUME PROFILE FIXED RANGE — PRO
Większość wskaźników pokazuje, dokąd poszła cena. Volume Profile pokazuje, gdzie faktycznie handlowano na rynku — poziomy, na których kupujący i sprzedający zaangażowali rzeczywisty wolumen. To właśnie te poziomy nadal działają jako wsparcie, opór i magnesy cenowe długo po zakończeniu ruchu.
Ten wskaźnik dostarcza kompletny, profesjonalny Volume Profile do cTrader: wybierz dowolny zakres na wykresie lub pozwól mu automatycznie tworzyć jeden profil na każdy dzień handlowy i natychmiast zobacz strukturę wolumenu, Punkt Kontroli i Obszar Wartości.
🆕 NOWOŚĆ W WERSJI 3
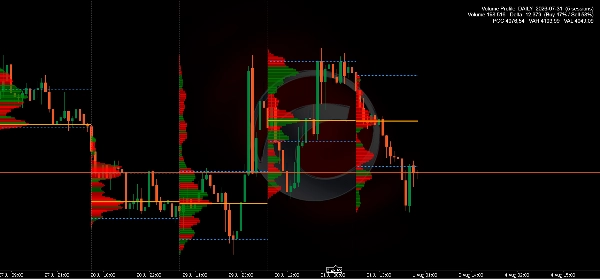
• Profile dzienne — każdy dzień handlowy ma własny profil, POC i Obszar Wartości, rysowane wewnątrz tego dnia i tworzone automatycznie podczas przewijania.
• Połączone krótkie sesje — cienkie otwarcie w niedzielę i półdni świąteczne są łączone z następnym dniem handlowym, zamiast pozostawiać za sobą skrócone profile.
• Histogram wewnątrz zakresu — trzecia pozycja, która kotwiczy profil do własnego zakresu zamiast krawędzi wykresu, dzięki czemu pozostaje tam, gdzie powinien podczas przewijania.
• Poziomy pozostające w swoim zakresie — POC, VAH i VAL mogą obejmować tylko własną sesję, a nie cały wykres, co utrzymuje czytelność wielu profili.
• Alerty poziomów — opcjonalne powiadomienie, gdy cena dotknie POC, VAH lub VAL, z okresem odnowienia, aby poziom testowany nie spamował Cię powiadomieniami.
• Profil na żywo — wolumen bieżącej świecy jest uwzględniany podczas handlu, nie tylko po zamknięciu słupka.
📊 CO POKAZUJE
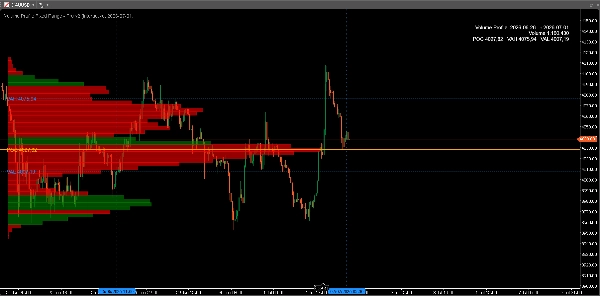
• POC (Punkt Kontroli) — poziom cenowy z najwyższym wolumenem obrotu w zakresie.
• Obszar Wartości (VAH / VAL) — strefa zawierająca 70% całego wolumenu (regulowana od 50% do 95%), obliczana standardową metodą rozszerzenia Market Profile, dzięki czemu Twoje poziomy odpowiadają temu, co widzą profesjonaliści na innych platformach.
• Histogram wolumenu — od 10 do 400 rzędów cenowych, każdy rząd podzielony na wolumen kupna i sprzedaży, dzięki czemu absorpcja i nierównowaga są widoczne na pierwszy rzut oka.
• Rozwijający się POC — jak ewoluowała najsprawiedliwsza cena w obrębie zakresu (opcjonalnie).
• Precyzja na poziomie minutowym — profil budowany jest z danych M1 nawet na wykresach H1 lub dziennych, znacznie dokładniejszy niż przybliżenie oparte na słupkach.
🎯 JAK UŻYWAJĄ TEGO TRADERZY
• Reakcje handlowe na POC — często zachowuje się jak silne wsparcie/opór i magnes do powrotu do średniej.
• Używaj krawędzi Obszaru Wartości do definiowania granic zakresu i wykrywania prawdziwych wybicia.
• Porównuj rozwijający się profil dzisiejszy z wczorajszym, aby zobaczyć, czy wartość rośnie, spada czy się utrzymuje.
• Identyfikuj strefy niskiego wolumenu, gdzie cena ma tendencję do szybkiego ruchu — naturalne cele i obszary stopów.
• Potwierdzaj kluczowe poziomy rzeczywistym udziałem rynku, a nie tylko samą akcją cenową.
⚙️ W PEŁNI DOSTOSOWYWALNY
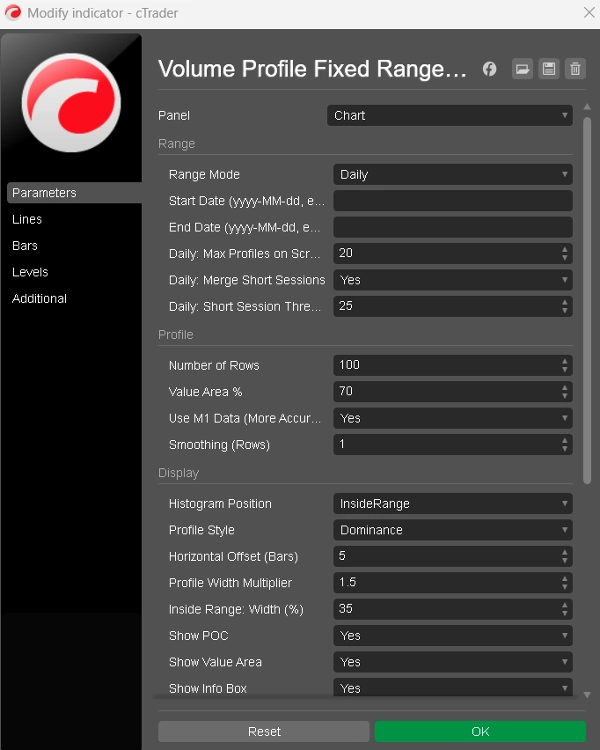
• Trzy tryby zakresu: przeciągnij dwie linie na wykresie, wpisz stałe daty lub dzienny.
• Trzy pozycje histogramu: prawa krawędź, lewa krawędź lub wewnątrz zakresu.
• Rzędy, procent Obszaru Wartości, wygładzanie, szerokość, przesunięcie i granice rzędów.
• Dwa style histogramu: podział kupno/sprzedaż lub pojedynczy kolor dominacji.
• Każdy kolor można dostosować; POC, Obszar Wartości, separatory dni, panel informacyjny i rozwijający się POC można włączać i wyłączać, a panel informacyjny może być umieszczony w dowolnym rogu.
🔧 STWORZONY DO CODZIENNEGO UŻYTKU
• Działa na dowolnym symbolu i dowolnym interwale czasowym.
• Sensowne ustawienia domyślne — użyteczny profil pojawia się kilka sekund po dołączeniu, bez konieczności konfiguracji.
• Wybrany zakres przetrwa zmiany interwałów i ponowne uruchomienia.
• Starsza historia jest ładowana automatycznie, gdy zakres tego wymaga, a wykres informuje, gdy dostępne dane nie pokrywają żądania.
• Płynny i wydajny: profil podąża za przewijaniem i powiększaniem bez migotania i przelicza się tylko wtedy, gdy jest to konieczne.
• Jednorazowy zakup. Brak subskrypcji. Darmowe aktualizacje.
Jeśli analiza wolumenu jest częścią Twojego procesu — lub chcesz, aby nią była — to narzędzie daje Ci kompletny zestaw Volume Profile, zbudowany natywnie dla cTrader.
Podsumowanie
Users can interactively select the range by dragging lines on the chart or specify fixed start and end dates. The volume histogram displays buy and sell volume splits per price level, enabling identification of buying/selling pressure and volume imbalances. Additional features include a developing POC line showing how the fair price evolved within the range, adjustable smoothing for profile shape refinement, and a theme-aware design for readability on different chart backgrounds.
The indicator supports full customization of rows, histogram style, colors, and display elements. It automatically loads historical data as needed and recalculates only when the selected range changes, optimizing performance. It is suitable for any symbol and timeframe, providing traders with volume-based support and resistance levels, breakout zones, and areas of low volume that may indicate rapid price movement.
Opinie klientów
5 | 67 % | |
4 | 0 % | |
3 | 33 % | |
2 | 0 % | |
1 | 0 % |


















