
Fixed Range Volume Profile
Wskaźnik
2 zakupy
Wersja 1.0, Jan 2026
Windows, Mac
4.0
Opinie: 2
Opis
Jak korzystać z Fixed Range Volume Profile (FRVP)
- Aktywuj wskaźnik: Przeciągnij i upuść wskaźnik FRVP na wybrany wykres z menu cTrader Automate lub Indicators.
- Wybierz narzędzie analityczne: Znajdź standardowe narzędzie do rysowania prostokątów na pasku narzędzi cTrader (zazwyczaj po prawej lub lewej stronie platformy).
- Zdefiniuj zakres: Kliknij i przeciągnij prostokąt na wybranym obszarze cenowym i okresie czasu, który chcesz analizować.
- Zainicjuj profil: Po narysowaniu, kliknij i delikatnie przesunąć prostokąt. Ten "uścisk dłoni" między rysunkiem a wskaźnikiem uruchamia obliczanie wolumenu, natychmiast generując histogram, POC i linie Value Area.
- Dostosuj dynamicznie: Możesz przeciągać krawędzie prostokąta, aby rozszerzyć zakres czasu lub przesunąć go na inny poziom cenowy; profil wolumenu automatycznie przeliczy się, aby odzwierciedlić nowy obszar.
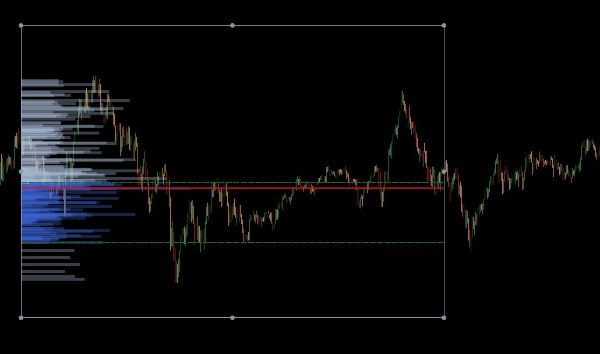
Fixed Range Volume Profile (FRVP) dla cTrader to zaawansowane narzędzie analityczne zaprojektowane do identyfikacji istotnych poziomów cenowych poprzez obliczanie rozkładu wolumenu w określonym zakresie czasu i cen. W przeciwieństwie do standardowych wskaźników wolumenu, które odpowiadają czasowi, ten wskaźnik skupia się na gęstości cen, aby ujawnić sentyment rynku.
Główne cechy
- Dynamiczny wybór zakresu: Wskaźnik automatycznie oblicza i aktualizuje się za każdym razem, gdy rysujesz lub przesuwasz standardowy prostokąt na wykresie cTrader.
- Identyfikacja kluczowych poziomów:
-
- Point of Control (POC): Podkreśla poziom cenowy z najwyższym wolumenem obrotu, działając jako "magnes" dla ruchu cen.
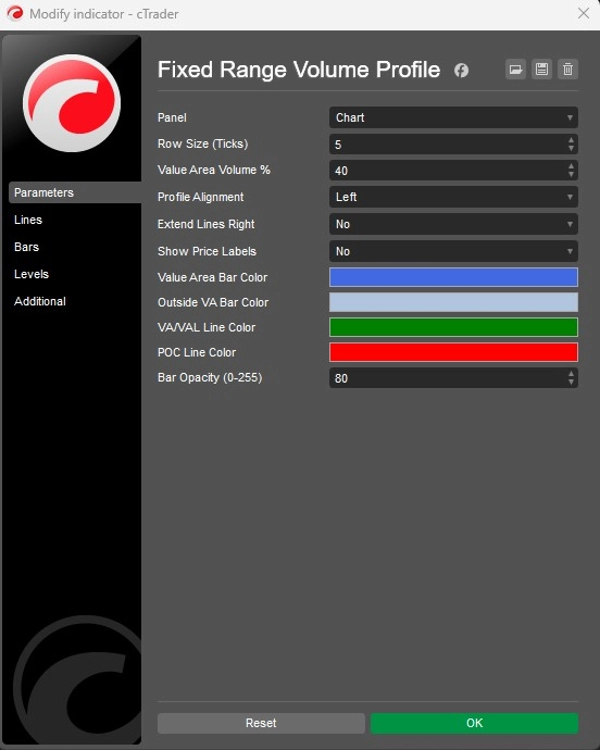
- Value Area High/Low (VAH/VAL): Definiuje granice, w których został zrealizowany określony procent wolumenu (domyślnie 40%).
- Konfigurowalne układy:
-
- Wyrównanie: Wybierz, czy wyświetlać histogram wolumenu po lewej czy prawej stronie prostokąta.
- Szczegółowość: Dostosuj wielkość wiersza (domyślnie 5 ticków), aby kontrolować szczegółowość słupków wolumenu.
- Wygląd: Pełna kontrola nad kolorami słupków (Value Area vs. Outside), przezroczystością oraz widocznością etykiet cenowych.
Zastosowanie strategiczne
- Wsparcie i opór: Węzły o wysokim wolumenie (HVN) często działają jako silne wsparcie lub opór, podczas gdy węzły o niskim wolumenie (LVN) reprezentują "cienkie" obszary, gdzie cena może szybko się poruszać.
- Potwierdzenie trendu: Użyj funkcji Extend Right, aby zobaczyć, jak historyczne poziomy wolumenu współdziałają z aktualnym ruchem cenowym w miarę jego rozwoju.
Podsumowanie
Podsumowanie AI
The Fixed Range Volume Profile (FRVP) indicator for cTrader analyzes volume distribution within a user-defined price and time range using a standard rectangle drawing tool. By selecting and adjusting this rectangle on the chart, the indicator dynamically calculates and displays a volume histogram along with key levels: Point of Control (POC), which marks the price with the highest traded volume, and Value Area High/Low (VAH/VAL), defining the volume concentration boundaries. Users can customize the histogram’s alignment, granularity (row size), colors, opacity, and price label visibility. The indicator supports dynamic range adjustments by dragging the rectangle edges, automatically recalculating volume data. Strategically, it helps identify support and resistance zones through high and low volume nodes and offers trend confirmation by extending volume levels into current price action. The FRVP is applicable across various markets including Forex, cryptocurrencies, commodities, indices, and stocks, and supports symbols such as BTCUSD, EURUSD, GBPUSD, XAUUSD, and NAS100. It integrates with cTrader’s drawing tools and provides a detailed volume-based perspective on price action beyond standard time-based volume indicators.
Profil wskaźnika
Opinie klientów
4.0
Opinie: 2
5 | 0 % | |
4 | 100 % | |
3 | 0 % | |
2 | 0 % | |
1 | 0 % |
Dyskusja
Częste pytania
BTCUSD
Forex
Signal
Breakout
Indices
EURUSD
Commodities
GBPUSD
NZDUSD
Fibonacci
Prop
Scalping
Fair Value Gap
SMC
Crypto
Stocks
XAUUSD
NAS100
USDJPY
VWAP
Produkty dostępne za pośrednictwem cTrader Store, w tym boty handlowe, wskaźniki i wtyczki, dostarczane są przez deweloperów zewnętrznych i udostępniane wyłącznie w celach informacyjnych oraz w celu zapewnienia dostępu technicznego. cTrader Store nie jest brokerem i nie zapewnia doradztwa inwestycyjnego, nie udziela spersonalizowanych rekomendacji ani nie gwarantuje przyszłych wyników.


Cena
Od 26/09/2025
16
Sprzedaż