present
Zarejestruj się i otrzymaj 50 $ zniżki na pierwszy zakup
Trading product for NEW ORDER FLOW MARKET DEPTH Wskaźnik Signal, image 1
NEW ORDER FLOW MARKET DEPTH
Wskaźnik
4 zakupy
Wersja 1.0, Mar 2026
Windows, Mac
4.0
Opinie: 1
Trading product for NEW ORDER FLOW MARKET DEPTH Wskaźnik Signal, image 2
Trading product for NEW ORDER FLOW MARKET DEPTH Wskaźnik Signal, image 3
Trading product for NEW ORDER FLOW MARKET DEPTH Wskaźnik Signal, image 4
Trading product for NEW ORDER FLOW MARKET DEPTH Wskaźnik Signal, image 5
50
Sprzedaż
306
Bezpłatne instalacje

Opis

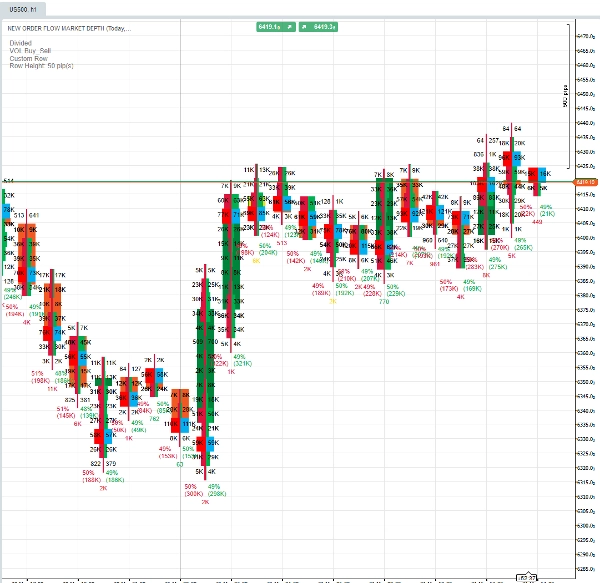
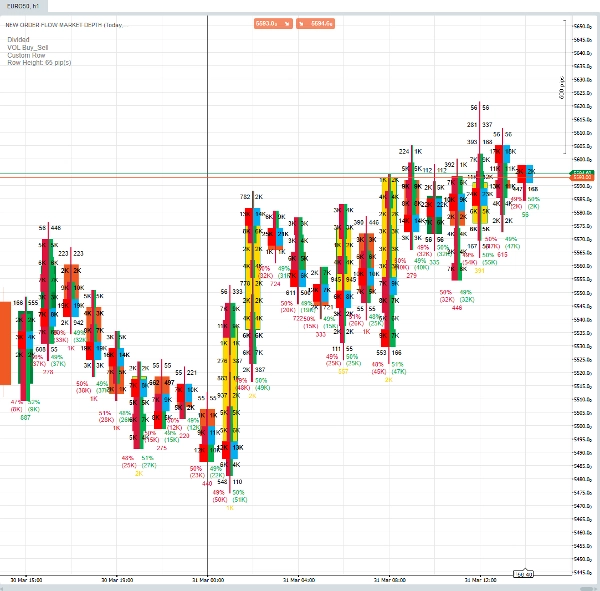
Order Flow Market Depth Pro wprowadza instytucjonalne koncepcje handlu na platformę cTrader dla detalicznych inwestorów. Analizując dane na poziomie ticków, ten wskaźnik ujawnia ukrytą presję kupna i sprzedaży w każdej świecy. Niezależnie od tego, czy handlujesz na rynku Forex, indeksach czy towarach, zrozum prawdziwe nastroje rynkowe dzięki precyzyjnym wykresom Footprint i nakładkom Depth of Market.

Kluczowe funkcje

  • 🔍 Tryby profilu wolumenu: Wybierz między Normalnym Wolumenem, Podziałem Kupna/Sprzedaży lub Analizą Delty.
  • 📊 Wykresy Footprint: Wizualizuj wolumen Bid vs. Ask na każdym poziomie cenowym (tryb Podzielony lub Profilowy).
  • 📈 Analiza Delty: Śledź agresywną presję kupna vs. sprzedaży z filtrowaniem skumulowanej delty.
  • 📉 Żywa głębokość rynku (DOM): Wizualizuj na żywo księgi zleceń limitowanych bezpośrednio na wykresie (ściany płynności Bid/Ask).
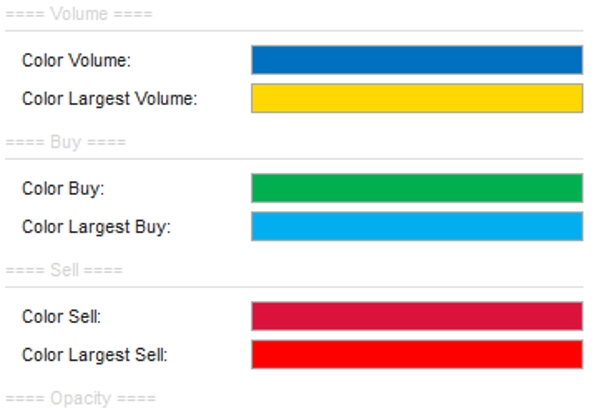
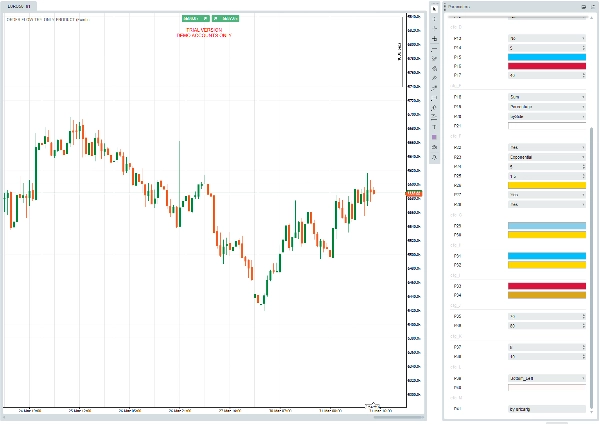
  • 🎨 Konfigurowalna wizualizacja: W pełni regulowane kolory, przezroczystość, wysokości wierszy i rozmiary czcionek, aby dopasować się do Twojego stylu handlu.
  • 🚀 Inteligentne filtrowanie: Wbudowane filtry średnich kroczących do wyróżniania istotnych skoków wolumenu i ignorowania szumu.
  • ⚡ Wysoka wydajność: Optymalizowany dla wykresów Renko, Range i Tick z efektywnym zarządzaniem danymi.

Szczegóły wersji próbnej

  • Tylko konto demo: Ta wersja próbna jest w pełni funkcjonalna, ale ograniczona do kont demo.
  • Limit 14 dni: Wskaźnik będzie aktywny przez 14 dni od pierwszego dołączenia do wykresu.
  • Widoczny znak wodny: Status wersji próbnej jest wyświetlany na wykresie, aby zapewnić zgodność.

Jak używać

  1. Dołącz wskaźnik do wybranego wykresu.
  2. Wybierz swój tryb VOL (Normalny, Kupno/Sprzedaż lub Delta).
  3. Dostosuj konfigurację wierszy do "Predefiniowane" dla standardowych ram czasowych lub "Niestandardowe" dla Renko/Range.
  4. Włącz Pokaż DOM, aby zobaczyć na żywo poziomy płynności (wymaga aktywnego źródła danych).
  5. Użyj filtra dużych wyników, aby wyróżnić słupki z nietypową aktywnością wolumenu.

Wymagania

  • Platforma cTrader Desktop lub Web.
  • Dostęp do danych tickowych (ładowane automatycznie przez wskaźnik).
  • Konto demo (dla wersji próbnej).

Wsparcie i aktualizacje

  • Regularne aktualizacje zapewniające kompatybilność z nowymi wersjami cTrader.
  • Dedykowane wsparcie w zakresie instalacji i konfiguracji.

Order Flow, Footprint, Market Depth, DOM, Volume Profile, Delta, Tick Volume, Renko, Range Bars, Institutional, Trial

Podsumowanie

Podsumowanie AI
Order Flow Market Depth Pro is an advanced indicator for the cTrader platform that applies institutional trading concepts to retail trading. It analyzes tick-level data to reveal hidden buying and selling pressure within each candle, supporting markets such as Forex, Indices, and Commodities. Key features include multiple volume profile modes (Normal Volume, Buy/Sell Split, Delta Analysis), Footprint charts that visualize bid versus ask volume at each price level, and cumulative Delta analysis to track aggressive buying and selling pressure. The indicator also displays live Market Depth (DOM) overlays showing real-time limit order books and liquidity walls directly on the chart. Users can customize visual elements like colors, opacity, row heights, and fonts to suit their trading style. Smart filtering with built-in Moving Average filters highlights significant volume spikes while reducing noise. It is optimized for Renko, Range, and Tick charts, ensuring high performance and efficient data handling. The trial version is fully functional on demo accounts for 14 days and includes a visual watermark. Requirements include the cTrader Desktop or Web platform and access to tick data, which the indicator loads automatically. Regular updates and dedicated support are provided for installation and configuration.
Profil wskaźnika
Kategoria wskaźnika
Przepływ zleceń / GłR
Typ wyjścia
Wizualizacja
Wymagania dotyczące danych
Tylko słupki
Dane tickowe
GłR
Wolumen
Obsługiwane sygnały
Zakres otwarcia sesji
Dywergencja

Opinie klientów

4.0
Opinie: 1
5
0 %
4
100 %
3
0 %
2
0 %
1
0 %
Opinie klientów
April 9, 2026
The better read comes from bad setups become easier to pass on. Volume context feels better when the tool stays in the background.

Dyskusja

Częste pytania

Signal
Produkty dostępne za pośrednictwem cTrader Store, w tym boty handlowe, wskaźniki i wtyczki, dostarczane są przez deweloperów zewnętrznych i udostępniane wyłącznie w celach informacyjnych oraz w celu zapewnienia dostępu technicznego. cTrader Store nie jest brokerem i nie zapewnia doradztwa inwestycyjnego, nie udziela spersonalizowanych rekomendacji ani nie gwarantuje przyszłych wyników.

Więcej od tego autora

cBot
VWAP
Signal
+4
Gold Profit Scalper Machine
4
Współczynnik zysku
cBot
ATR
Volume
+5
HEDGE GRID STRATEGY PRO Advanced Algorithmic Trading System
7%
ROI
12
Współczynnik zysku
cBot
BTCUSD
EPIC FURY
5.56
Współczynnik zysku
Wskaźnik
Forex
BTCUSD
+12
Pro Structure Patterns Detector
Wskaźnik
Volume
Moving Average
Multi-Timeframe Rolling Volatility Indicator - Smart Volatility Breakout System
Wskaźnik
BTCUSD
Crypto
Decode the Market's Hidden Rhythms. Combine Spectral Analysis with Stochastic Forecasting for a True Probabilistic Edge
cBot
ATR
EMA
+2
XAURUM GRID PRO, ADVANCED XAUUSD GRID ALGORITHM
1.15
Współczynnik zysku
cBot
ATR
EMA
+5
APEX-Adaptive Multi-Engine Position Algorithmic System
53.3%
ROI
8.86
Współczynnik zysku
cBot
ATR
Volume
+5
FRACTAL ALPHA-EDGE
7.97
Współczynnik zysku
Wskaźnik
EMA
CHOCH
+1
Volatility Oscillator & Detector: Professional Conditional Volatility Predictive. Stop reacting to volatility
Wskaźnik
VWAP
Volume
+2
VWAP Bands and Swing Wick Structure Indicator
Wskaźnik
BOS
CHOCH
+5
Market Structure Indicator

Możesz także polubić

Wskaźnik
CHOCH
Fair Value Gap
+2
Advanced FVG & IFVG indicator with multi-timeframe confluence, CHoCH filtering, and smart mitigation.
Wskaźnik
VWAP
NAS100
+5
Key NY session opens for NASDAQ (US100) & SP500 to find Tick Precise Entrys for High R:R intraday setups.
Wskaźnik
Forex
BTCUSD
+5
INDICATOR,LIQUIDITY POOLS,ACCURATE SIGNAL, NO DELAY,80% PROBABILITY
Wskaźnik
Key Levels
Market Structure
+1
Sessions, ICT killzones, multi-ORB and previous levels. One clean, no-repaint cTrader overlay.
Logo „Zigzag Trend”
Najwyżej oceniane
4.5
(4)
$25
/
$45
Wskaźnik
AI
ATR
+23
The ZigZag Trend is a market structure tool that filters out small price fluctuations and highlights major swing.
Wskaźnik
AI
Prop
+16
Pro trading dashboard: WVAP analysis + Volume Profile + Neural AI tracking + News alerts. All-in-one tool!
Logo „E7 BBKG Indicator”
Najwyżej oceniane
4.5
(4)
$25
/
$50
Wskaźnik
Prop
E7 BBKG indicator with 80% plus accuracy used to show both, possible reversal and trend.
Wskaźnik
ATR
Channel
+3
Catch trend with precision. BUY/SELL arrows, real-time dashboard, sound alerts and ATRchannel. Works on all markets.
Wskaźnik
Forex
Crypto
+3
Enhance Pitchfork & Price Channels in cTrader with customizable Equidistant and Fibonacci levels.
Wskaźnik
Prop
Forex
+13
"Footprint Chart: Visualize bid-ask volume inside candles for clearer order flow and market depth insights."
Wskaźnik
ATR
Prop
+6
🟢 Strength-ranked S/R zones with MTF levels and Pro labels. Nearest-zone band and HUD for faster, cleaner entries. 🔴
Wskaźnik
Key Levels
Support & Resistance
Professional Opening Range Breakout indicator with live ORB levels and breakout detection.
Wskaźnik
BOS
CHOCH
+4
Dual-track market structure detection with BVC order flow confirmation and two-stage liquidity sweep validation.
Wskaźnik
SMC
VWAP
+4
Killzone Session and key levels with VWAP – Precision Meets Price Action
Wskaźnik
VWAP
Volume
+4
Advanced Order Flow & Volume Profiling for cTrader. Unveil institutional footprints, Delta, and Anchored VWAPs.
Wskaźnik
RSI
Volume
+3
Auto-detects swings, Includes POC, Value Area (VAH/VAL), High Volume Nodes (HVN), Fibonacci retracement, and RSI overlay
Wskaźnik
SMC
Prop
+14
Right-anchored cTrader Volume Profile with VAH/VAL/POC, LVZ, top volume+EMA, themes, and fast, readable visuals.
Wskaźnik
Prop
Institution-level trend Analyzer.

Cena

50
Sprzedaż
306
Bezpłatne instalacje