present
가입하고 첫 구매 시 $50 할인을 받으세요
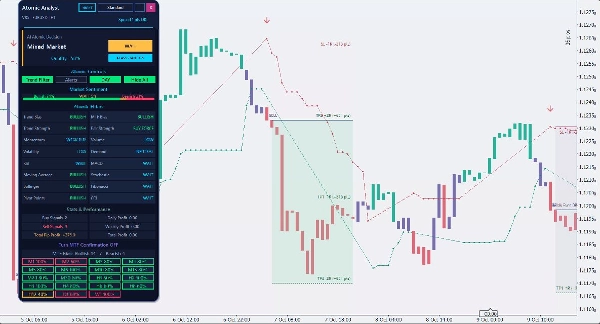
Trading product for Atomic Analyst 지표 Key Levels, image 1
Atomic Analyst
지표
버전 1.1, Oct 2026
Windows, Mac
Trading product for Atomic Analyst 지표 Key Levels, image 2
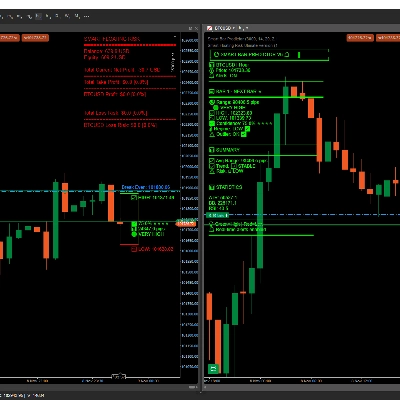
Trading product for Atomic Analyst 지표 Key Levels, image 3
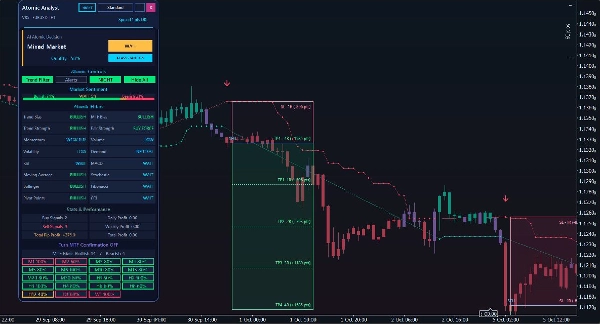
Trading product for Atomic Analyst 지표 Key Levels, image 4
가입일 16/10/2026

설명

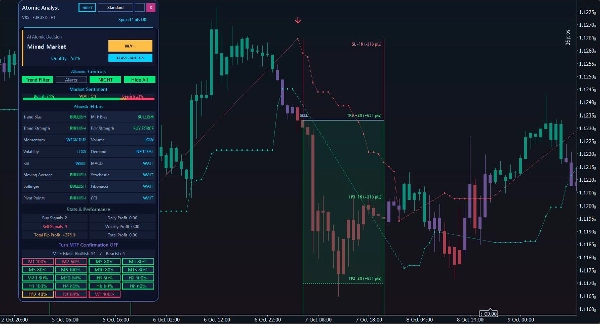
Atomic Analyst brings trend context, trade planning and multi-timeframe analysis into one interactive cTrader indicator. Its movable on-chart panel helps you review the market before deciding whether to act.


READ THE TREND

Use Trend Filter to focus on trend-based buy and sell signals. Review trend bias, strength, momentum, volatility and the supporting technical filters together. Multi-timeframe cells provide additional context across supported chart periods.


PLAN THE TRADE VISUALLY

See the indicated entry, stop-loss and reward levels directly on the chart. Transparent trade-glass boxes keep the candlesticks visible while showing the analytical plan and its historical progress. Target, break-even and stop outcomes help you review how a selected setup developed.


KEEP YOUR WORKSPACE CLEAR

Move or collapse the panel, choose its display size, and use day, night or custom chart themes. Toggle chart visuals and alerts from the panel. Desktop popup, sound and configurable email alerts are available; email requires your cTrader email settings.


GET STARTED

Attach Atomic Analyst to a cTrader Windows time-based chart and allow its history to finish loading. H1 is a practical starting point for reviewing the examples supplied here. Select Trend Filter, inspect the signal and its risk levels, and assess the wider market before making your own decision. The gallery uses EURUSD H1; broker data, settings, spread and trading costs can change the results you see. Test your chosen instrument and settings on a demo account first.


UNDERSTAND THE DISPLAY

Atomic Analyst is an analysis indicator; it does not place trades for you. The AI Assistant and quality reading summarize technical agreement, not a probability of profit. Historical trade-glass results are analytical illustrations, not verified account returns or an execution backtest. The gallery deliberately selects winning examples to demonstrate the interface; losing and break-even signals also occur. The panel shows its current market assessment even when the chart is scrolled into the past.


Trading involves risk. Past performance does not guarantee future results.

요약

지표 프로필
지표 카테고리
추세
출력 유형
시각화
신호
데이터 요구 사항
막대만
지원되는 신호
추세 강도

상담

고객 리뷰

0.0
리뷰: 0
고객 리뷰
이 상품에 대한 리뷰가 아직 없습니다. 이미 사용해 보셨나요? 다른 사람들에게 가장 먼저 소개해 주세요!

자주 묻는 질문(FAQ)

Key Levels
트레이딩 봇, 지표, 플러그인 등 cTrader Store에서 제공되는 상품은 제3자 개발자에 의해 제공되며, 이는 단순히 정보 및 기술적 접근을 목적으로 제공된 것입니다. cTrader Store는 중개인이 아니며, 투자 조언, 개인별 추천 또는 향후 성과에 대한 어떠한 보장도 제공하지 않습니다.

이 작성자의 상품 더 보기

지표
RSI
VWAP
+5
Trend direction, chart signals, reversal zones and volume tools in one configurable indicator.
지표
Volume
Order Block
+3
Map market structure, order blocks, liquidity and key zones with an interactive cTrader dashboard.
지표
Volume
Key Levels
+1
Six timeframe decisions, chart trade plans and historical risk simulation in one interactive cTrader indicator.
지표
Volume
Support & Resistance
Compare up to 27 symbols across eight timeframes with seven analysis engines and an interactive cTrader dashboard.
지표
Fibonacci
Key Levels
+1
Explore Elliott wave counts, three swing sizes and example levels with an interactive cTrader chart panel.
지표
ATR
Key Levels
+1
Explore 88 harmonic price-pattern variants with interactive chart controls and geometric reference levels.

좋아하실 만한 다른 항목

지표
Track VWAP for Asia, London, NY, Sydney, Daily, Weekly, Monthly & Custom Sessions. Perfect for FX & intraday trading!
지표
Volume
Key Levels
+1
Tape Reading indicator ,book and flow analysis
지표
Grid
Prop
+5
This technical analysis indicator provides information on market sentiment, trend and price levels....
지표
Liquidity Grab
Liquidity Sweep
+1
CRT Sweep Tracker is an advanced panel for Candle Range Theory (CRT) traders to track HTF sweeps and manage live trades.
지표
Forex
Indices
+5
Market Profile TPO for cTrader — full auction logic, IB, POC, VA zones, histogram and O/X markers with time
지표
Risk Dashboard
AI-powered daily range forecasts help traders spot volatility opportunities and plan stops and targets.
지표
SMC
Prop
+13
Tracks virgin levels. Lines vanish only after a candle closes beyond the high/low on your chosen timeframe.
지표
ATR
Key Levels
+1
Explore 88 harmonic price-pattern variants with interactive chart controls and geometric reference levels.
지표
AI
ATR
+27
🔮 Smart Bar Predictor - Professional Volatility Forecasting Indicator
지표
SMC
Forex
+5
Detects Break of Structure (BOS) and Change of Character (CHOCH)
지표
ATR
Volume
+3
Fibonacci trend signals on closed bars, with an ATR stop, up to four targets and a break-even ladder.
지표
Forex
Crypto
+5
This indicator combines two independent analytical engines into a single overlay on your chart.
지표
AI
Grid
+17
Clean 3D, Sleek Candles for Trend Patterns.
지표
Fibonacci
Key Levels
+1
Explore Elliott wave counts, three swing sizes and example levels with an interactive cTrader chart panel.
지표
SMC
Prop
+12
SMC Pro Suite: OBs, FVGs, Structure, Liquidity, Killzones & MTF overlay. Every concept in one cTrader indicator.
지표
SMC
Grid
+19
Smart fractals + auto Fibonacci + dynamic S/R zones with HTF confluence & Bull/Bear bias panel. Institutional-grade.
지표
Volume
Support & Resistance
Compare up to 27 symbols across eight timeframes with seven analysis engines and an interactive cTrader dashboard.
지표
Forex
Crypto
+5
📈 Initial Balance Breakout Signals: visually accurate IB levels, breakout alerts & forecast zones for smart trading.

가격

가입일 16/10/2026