
Deskripsi
🧠 Apa itu (dalam praktik)
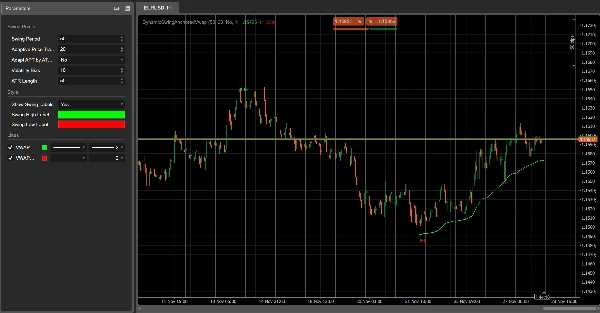
Ini adalah Dynamic Swing-Anchored VWAP yang secara otomatis mengikat ulang ke pivot ayunan signifikan terbaru (tinggi/rendah). Alih-alih bergantung pada jangkar sesi tetap, ini menyesuaikan dengan struktur pasar dan terus menyoroti zona “nilai wajar” yang realistis berdasarkan dinamika harga dan volume.
🧩 Struktur ayunan (logika pivot)
Dengan menggunakan Periode Ayunan, indikator mendeteksi titik balik utama:
- Pivot Tinggi ketika harga membentuk titik tertinggi dalam jendela peninjauan
- Pivot Rendah ketika harga membentuk titik terendah dalam jendela peninjauan
Ketika pivot aktif berubah, segmen VWAP diatur ulang dan diikat ulang, memberikan konteks struktural yang jelas.
⚙️ Perilaku VWAP adaptif (APT + volatilitas)
Dengan Adaptive Price Tracking (APT), VWAP dapat disesuaikan agar lebih ketat atau lebih halus:
- APT lebih rendah → reaksi lebih cepat (lebih dekat dengan harga)
- APT lebih tinggi → reaksi lebih lambat (pandangan makro yang lebih bersih)
Jika adaptasi volatilitas diaktifkan, APT secara otomatis menyesuaikan menggunakan rasio ATR, membuat indikator lebih responsif selama volatilitas tinggi dan lebih halus selama kondisi tenang.
🚦 Cara membacanya (sinyal utama)
✅ Perubahan struktur (perubahan jangkar) → potensi perubahan rezim / fase pasar baru
✅ Harga di atas/bawah VWAP → filter bias bullish/bearish
✅ Break & retest VWAP → salah satu setup konfirmasi terkuat
✅ Label HH/HL vs LH/LL → kualitas tren dan kekuatan kelanjutan
✅ Kemiringan VWAP → momentum dan kesehatan pasar
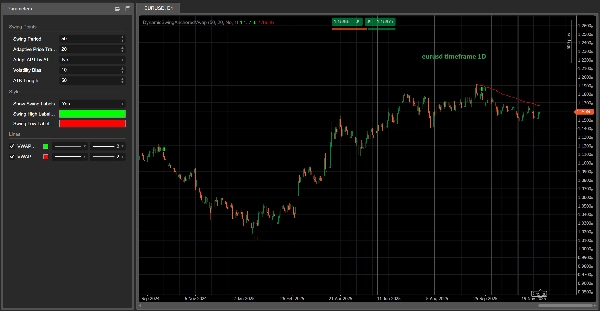
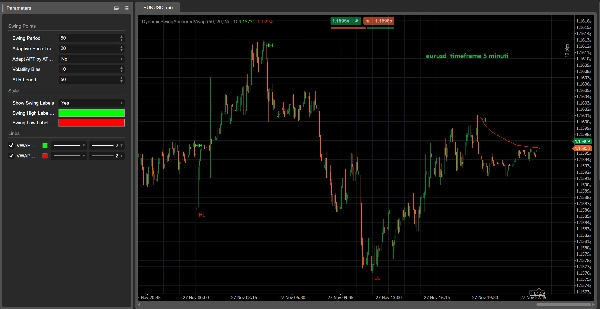
🖼️ Keunggulan multi-timeframe (terlihat di tangkapan layar)
Tangkapan layar menunjukkan dengan jelas bahwa, saat menganalisis aset yang sama di beberapa timeframe, indikator memperbarui dan menyelaraskan kembali ke ayunan setiap timeframe—memudahkan untuk melihat kapan timeframe selaras (sinyal lebih kuat) atau berkonflik (lebih banyak ketidakpastian/jangkauan). Ini memberikan bias arah yang jelas tentang ke mana pasar memiliki probabilitas lebih tinggi untuk bergerak selanjutnya.
📩 Ingin performa terbaik? Hubungi kami!
Jika Anda menginginkan optimasi terbaik, penyesuaian parameter yang disesuaikan untuk aset/timeframe Anda, dan akses ke alat trading fantastis kami, jangan ragu untuk menghubungi kami — kami akan membantu Anda mendapatkan sinyal paling bersih dan setup paling efektif untuk strategi Anda. 🚀
Ringkasan
This indicator features Adaptive Price Tracking (APT), allowing users to adjust the VWAP’s sensitivity for faster or smoother reactions to price changes. When volatility adaptation is enabled, APT automatically adjusts based on the Average True Range (ATR) ratio, enhancing responsiveness during volatile periods and smoothing during calmer markets.
Key signals include detecting structure shifts via anchor changes, price positioning relative to the VWAP for bullish or bearish bias, break and retest patterns of the VWAP as confirmation setups, trend quality through higher highs/lows versus lower highs/lows, and VWAP slope indicating momentum and market health.
The indicator supports multi-timeframe analysis by realigning to each timeframe’s swings, helping identify alignment or conflict across timeframes for clearer directional bias. It is applicable across various markets including Forex, cryptocurrencies, commodities, indices, and stocks.
Ulasan pelanggan
5 | 100 % | |
4 | 0 % | |
3 | 0 % | |
2 | 0 % | |
1 | 0 % |


