
Half Trend BT
Wskaźnik
36 zakupy
Wersja 1.0, Mar 2025
Windows, Mac
4.3
Opinie: 3
Opis
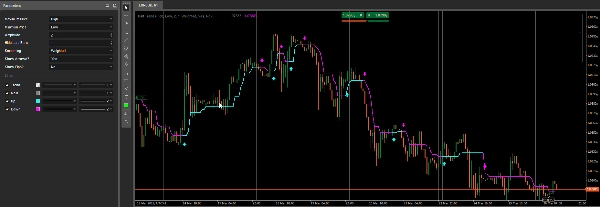
Wskaźnik Half Trend został zaprojektowany do wykrywania i podkreślania potencjalnych odwróceń trendu poprzez porównanie ostatnich maksimów i minimów w określonym okresie, a następnie odpowiednie rysowanie linii „Wzrost” lub „Spadek”. Opcjonalnie rysuje strzałki przy każdej zmianie trendu i może wyświetlać różnice w pipsach między sygnałami.
- Wybór serii High/Low
- Wskaźnik używa dwóch serii cenowych (domyślnie High i Low) do śledzenia lokalnych maksimów i minimów.
- Możesz wybrać różne typy cen (np.
Open,Close,Medianitd.) dla każdej serii za pomocą Maximum Price oraz Minimum Price.
- Średnie kroczące i obliczanie okresu
- Średnia krocząca (oparta na wybranym typie Smoothing oraz okresie Amplitude) jest stosowana do obu wybranych serii cen „high” i „low”.
- Wskaźnik porównuje ceny bieżącej świecy z tymi wygładzonymi poziomami high/low, aby zdecydować, czy przejść z trendu wzrostowego na spadkowy (lub odwrotnie).
- Wykrywanie trendu i rysowanie
- Jeśli wskaźnik wykryje trend wzrostowy, rysuje linię Up (cyjan) i ustawia
Trendna+1. - Jeśli wykryje trend spadkowy, rysuje linię Down (magenta) i ustawia
Trendna-1. - Główne Main wyjście (szare) jest aktualizowane wewnętrznie, aby odzwierciedlać aktualne poziomy wsparcia/oporu.
Trendto niewidoczna seria wyjściowa przechowująca kierunek trendu numerycznie (+1lub-1).
- Jeśli wskaźnik wykryje trend wzrostowy, rysuje linię Up (cyjan) i ustawia
- Strzałki i obliczanie pipsów
- Pokazać strzałki? – Jeśli włączone, wskaźnik rysuje strzałkę na każdej nowej świecy, gdzie wykryto odwrócenie trendu.
- Pokazać pipsy? – Jeśli włączone, oblicza i wyświetla różnicę pipsów między ostatnim sygnałem a nowym sygnałem, rysując małą etykietę i linię trendu na wykresie.
Podsumowanie
Podsumowanie AI
The Half Trend BT indicator detects potential trend reversals by analyzing recent highs and lows over a specified period. It compares two selected price series—typically High and Low, but configurable to other price types such as Open, Close, or Median—using moving averages based on chosen smoothing methods and amplitude periods. The indicator plots an "Up" line (cyan) when an uptrend is detected and a "Down" line (magenta) for a downtrend, while internally storing trend direction numerically (+1 or -1). A main output line (gray) reflects current support and resistance levels. Optional features include drawing arrows on bars where trend reversals occur and calculating pip differences between signals, which are displayed as labels and trendlines on the chart. This indicator supports multiple markets including Forex, indices, commodities, cryptocurrencies, and stocks.
Profil wskaźnika
Opinie klientów
4.3
Opinie: 3
5 | 33 % | |
4 | 67 % | |
3 | 0 % | |
2 | 0 % | |
1 | 0 % |
Opinie klientów
March 29, 2025
Clean idea for traders around chart reading. The useful part is adding confirmation before a trade, with the numbers checked before scaling. The cleaner reads should hold across 3 sessions, not just 1 good chart. It is stronger when a 1.5R target is realistic before the entry.
March 28, 2025
March 28, 2025
Decent tool for testing if the trader wants it makes market context easier to scan. It works best as support, not a final decision maker. I would test it on 2 timeframes, 20 signals and a 1R stop plan. it should not be used as a blind entry trigger.
Dyskusja
Częste pytania
Prop
Forex
Signal
Indices
Commodities
Crypto
Stocks
Produkty dostępne za pośrednictwem cTrader Store, w tym boty handlowe, wskaźniki i wtyczki, dostarczane są przez deweloperów zewnętrznych i udostępniane wyłącznie w celach informacyjnych oraz w celu zapewnienia dostępu technicznego. cTrader Store nie jest brokerem i nie zapewnia doradztwa inwestycyjnego, nie udziela spersonalizowanych rekomendacji ani nie gwarantuje przyszłych wyników.


Cena
46
Sprzedaż
1.02K
Bezpłatne instalacje