

説明
標準の相対力指数(RSI)は世界で最も人気のある指標の一つですが、チャートの下部に単一のラインを描くのは時代遅れの取引方法です。これでは真のモメンタムの変化、加速、市場のもみ合いを見つけるのが難しくなります。
このRSI Advancedはこの古典的なオシレーターを完全に再発明しました。シグナルライン、ボラティリティフィルター、スマートチャートペインティングを導入することで、RSIを包括的なオールインワンのモメンタムおよびトレンドフォローのダッシュボードに変えます。
主な特徴
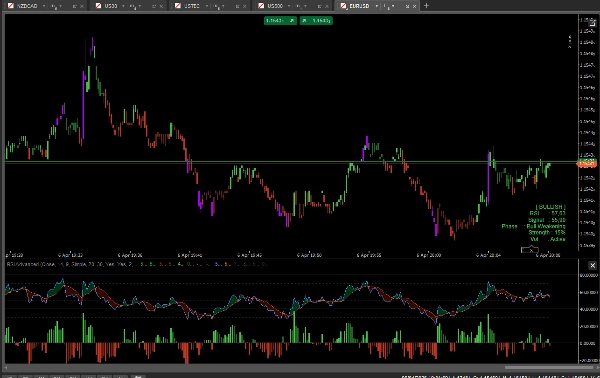
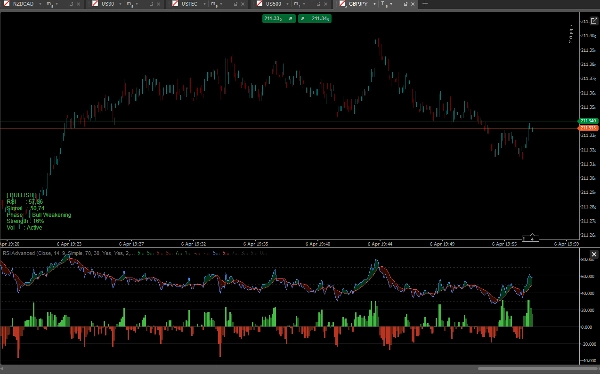
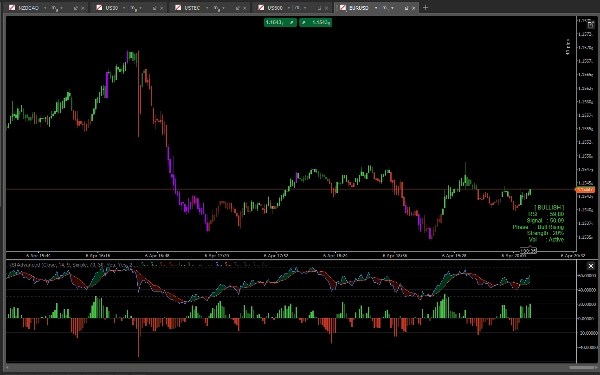
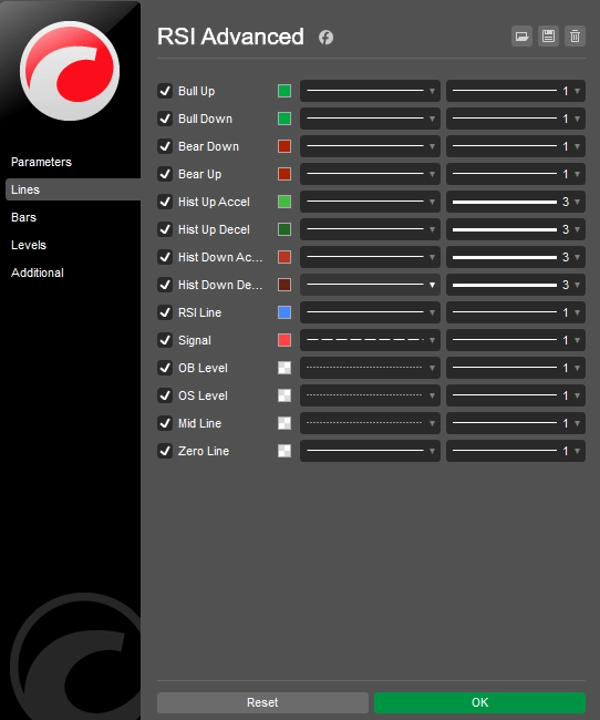
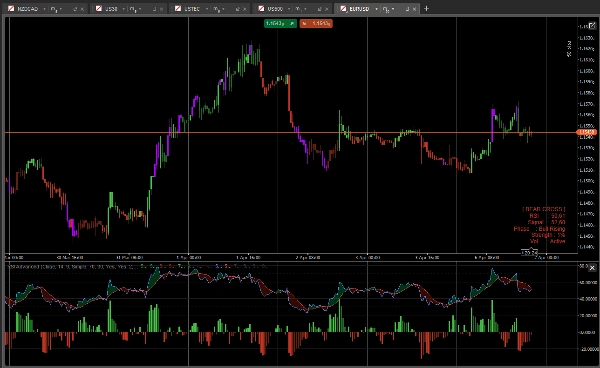
- RSI & シグナルクラウド: RSIに移動平均(シグナルライン)を追加しました。RSIとそのシグナルラインの間のスペースは動的なクラウドで埋められます。クラウドが緑色なら強気がモメンタムを牽引しています。赤色なら弱気が支配しています。
- モメンタムヒストグラム: 中心を基準としたヒストグラムがRSIとシグナルラインの正確な距離を追跡します。内蔵の加速/減速色(明るい色と暗い色)により、クロスオーバーやモメンタムの消耗を事前に予測できます。
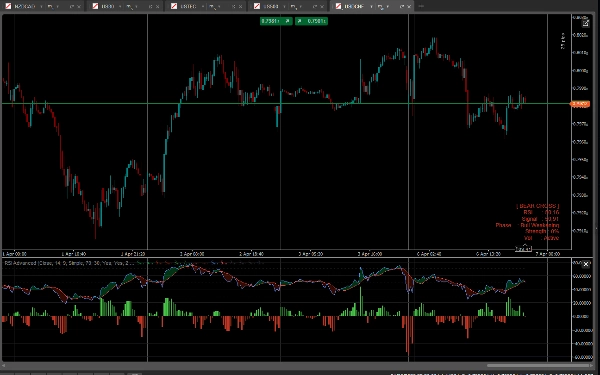
- スマートバー着色(ペイントバー): あなたのローソク足は基礎となるRSIモメンタムに基づいて色が変わります:
-
- 明るい緑/赤:強い強気/弱気の整合(RSI > 50かつRSI > シグナル)。
- 暗い緑/赤:弱いモメンタムまたは押し戻し。
- 紫/マゼンタ:極端な買われ過ぎ(OB)または売られ過ぎ(OS)レベル-潜在的な反転の警告。
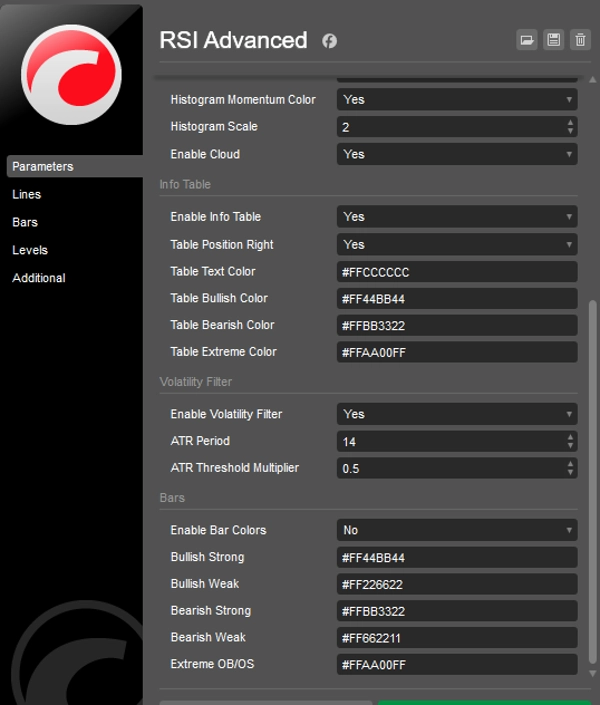
- スマートボラティリティフィルター(ATR): フラットな市場でのもみ合いに疲れましたか?内蔵のATRフィルターを有効にしてください。ボラティリティが過去の平均を下回ると、ローソク足とヒストグラムが灰色になり、悪い取引を避けられます。
- チャート上情報ダッシュボード: スタイリッシュなデータパネルがリアルタイムの指標を表示します:正確なRSIとシグナル値、モメンタムフェーズ、トレンド強度のパーセンテージ、ボラティリティステータス。
- 完全にアンロック: どんなシンボル(FX、暗号通貨、指数、株式)でも、どんな時間枠でも制限なく取引可能。生涯アクセス。
使い方は?
- トレンド継続: RSIが50の中間線の上に留まりつつ、シグナルラインにわずかに触れる押し戻しを探します。ヒストグラムが加速(明るい緑)し、ローソク足が明るい緑に変わると、強い継続エントリーです。
- 反転: ローソク足が紫色(極端なOB/OS)に変わったら、RSIがシグナルラインを再び越えるのを待ちます(クラウドの色が変わる)と、高確率の反転セットアップです。
- もみ合い回避: ボラティリティフィルターでバーが灰色になったら、手を出さずに市場が動き出すのを待ちましょう。
概要
インジケーターのプロフィール
インジケーターのカテゴリー
ボラティリティ
出力の種類
フィルター
データ要件
バーのみ
サポート対象のシグナル
クロス
トレンドの強さ
ボラティリティ
カスタマーレビュー
5.0
レビュー: 1
5 | 100 % | |
4 | 0 % | |
3 | 0 % | |
2 | 0 % | |
1 | 0 % |
カスタマーレビュー
April 11, 2026
The first thing that worked was timing feels less random, and a small account test feels safer.
ディスカッション
よくあるご質問
BTCUSD
Forex
Signal
Indices
EURUSD
Commodities
GBPUSD
NZDUSD
RSI
AI
XAUUSD
NAS100
ATR
USDJPY
cTrader Storeで入手可能な取引ボット、インジケーター、プラグインなどの商品は、第三者の開発者が提供するものであり、情報と技術の取得のみを目的としてご利用いただけます。cTrader Storeはブローカーではなく、投資助言や個人的な推奨を行うことも、将来のパフォーマンスを保証することもありません。


これも好きかも


価格
24
販売
662
無料インストール