
Descrizione
Dot Momentum %BB Dynamic Visualizer per cTrader
Quantifica la volatilità. Visualizza il momentum. Padroneggia i tuoi ingressi.
Scatena la potenza della volatilità con il Bollinger Bands %B Dynamic Visualizer, un indicatore personalizzato unico per cTrader progettato per offrirti una comprensione senza precedenti dell'azione del prezzo rispetto al suo involucro di volatilità. Andando oltre le tradizionali Bande di Bollinger, questo indicatore trasforma metriche di volatilità complesse in un flusso intuitivo e codificato a colori di cerchi, aiutandoti a identificare punti di svolta cruciali del mercato e la forza del trend.
Cos'è Bollinger Bands %B e in cosa differisce?
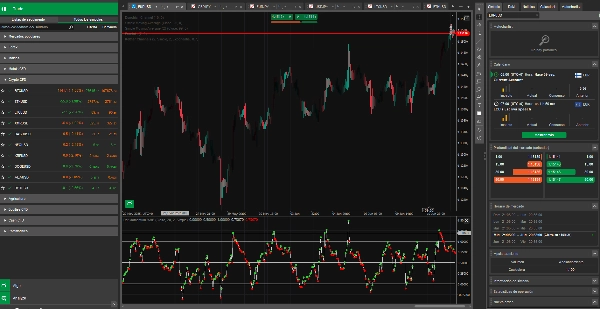
Mentre le Bande di Bollinger standard si sovrappongono direttamente al grafico dei prezzi, mostrando supporti/resistenze dinamici e rappresentando visivamente la volatilità del mercato attraverso la loro espansione e contrazione, il Bollinger Bands %B è un oscillatore. Viene visualizzato in un pannello separato sotto il grafico principale, fornendo una misura quantificabile di dove si trova il prezzo attuale all'interno dell'involucro delle Bande di Bollinger.
Non mostra il prezzo direttamente; invece, rivela la posizione relativa del prezzo su una scala da 0 a 1:
- 0.0: Il prezzo è alla Banda di Bollinger Inferiore.
- 0.5: Il prezzo è alla Banda di Bollinger Media (la Media Mobile).
- 1.0: Il prezzo è alla Banda di Bollinger Superiore.
Vantaggi e contesto di volatilità:
Questo indicatore va oltre la semplice osservazione. Quantifica la posizione del prezzo rispetto alla sua volatilità intrinseca, permettendoti di:
- Valutare la forza del trend: Un %B persistente sopra 0.5 suggerisce un forte momentum rialzista, mentre sotto 0.5 indica pressione al ribasso.
- Identificare potenziali inversioni: Letture estreme (vicino a 0.0 o 1.0) possono segnalare che il prezzo è sovraesteso all'interno del suo attuale intervallo di volatilità.
- Comprendere la volatilità contestuale: La volatilità stessa (rappresentata dalla larghezza delle Bande di Bollinger sottostanti) è sempre contestuale al timeframe che stai osservando. Una lettura %B su un grafico a 1 ora riflette la volatilità in modo diverso rispetto a un grafico a 1 giorno. Il nostro indicatore si adatta perfettamente al timeframe scelto, fornendo approfondimenti rilevanti.
Caratteristiche tecniche:
- Calcolo preciso: %B è calcolato come: (Prezzo Corrente−Banda Inferiore)/(Banda Superiore−Banda Inferiore)
- Codifica colore dinamica (cerchi):
-
- Cerchi verde lime: Indicano che il valore %B sta salendo rispetto alla barra precedente, segnalando momentum rialzista.
- Cerchi rossi: Indicano che il valore %B sta scendendo rispetto alla barra precedente, segnalando momentum ribassista.
- Cerchi argento: Visualizzati quando il valore %B rimane invariato o per il primo punto valido.
- Linea del percorso sottile: Una linea sottile grigio chiaro traccia delicatamente il percorso complessivo del valore %B, fornendo continuità visiva sotto i cerchi dinamici.
- Marcatori di livello discreti: Linee solide grigio scuro a 0.0, 0.5 e 1.0 (facilmente visibili senza sovrastare la visualizzazione principale) forniscono punti di riferimento chiari per gli estremi di volatilità e la media.
- Personalizzabile: Regola il periodo delle Bande di Bollinger, le deviazioni standard e il tipo di MA direttamente dalle impostazioni.
Spiegazione semplificata: segnali di iper-volatilità (come un RSI per la volatilità!)
Pensa a questo indicatore come a un RSI, ma per l'eccesso di volatilità invece che per semplici livelli di ipercomprato/ipervenduto del prezzo.
- Quando i cerchi toccano o scendono sotto 0.0, significa che il prezzo sta spingendo con forza contro il fondo del suo attuale involucro di volatilità. Questo è come un segnale di "volatilità ipervenduta", suggerendo che il mercato potrebbe essere eccessivamente esteso al ribasso nel suo contesto attuale.
- Quando i cerchi toccano o superano 1.0, significa che il prezzo sta spingendo con forza contro la cima del suo attuale involucro di volatilità. Questo è come un segnale di "volatilità ipercomprata", suggerendo che il mercato potrebbe essere eccessivamente esteso al rialzo nel suo contesto attuale.
Queste letture estreme non significano necessariamente "compra" o "vendi" immediatamente, ma sono avvisi potenti che il mercato si trova in un punto estremo all'interno del suo tipico intervallo di movimento per quel specifico timeframe. Questo spesso precede una potenziale inversione verso la media o un cambiamento nel comportamento della volatilità del mercato.
Riepilogo
Recensioni dei clienti
5 | 0 % | |
4 | 100 % | |
3 | 0 % | |
2 | 0 % | |
1 | 0 % |


