Opis
HCCC MTF - Hurst Cycle Composite Channel (100% DARMOWY)
Przegląd
The HCCC MTF (Hurst Cycle Composite Channel) to zaawansowany, w pełni interaktywny wskaźnik i pulpit Multi-Timeframe (MTF). Opierając się na teoriach cyklicznych J.M. Hursta połączonych z zmiennością ATR, to narzędzie pomaga zidentyfikować prawdziwy trend rynkowy oraz idealne cykliczne punkty zwrotne (szczyty i dołki) na wielu ramach czasowych jednocześnie.
Drugi dedykowany do półautomatycznego handlu z https://ctrader.com/products/3618?u=cLogic
WAŻNE: Ten wskaźnik jest całkowicie 100% DARMOWY dla wszystkich. Został specjalnie opracowany jako ostateczny wizualny towarzysz dla cBota "Follow The Trend XAU Edition".
Chociaż możesz go używać doskonale do handlu manualnego, jego prawdziwa moc ujawnia się przy użyciu w półautomatycznym ustawieniu: używasz pulpitu HCCC do odczytu cyklu i momentum na wyższych ramach czasowych, a następnie włączasz cBota Follow The Trend XAU Edition, aby precyzyjnie wykonywać i zarządzać transakcjami w tym kierunku.
Kluczowe funkcje
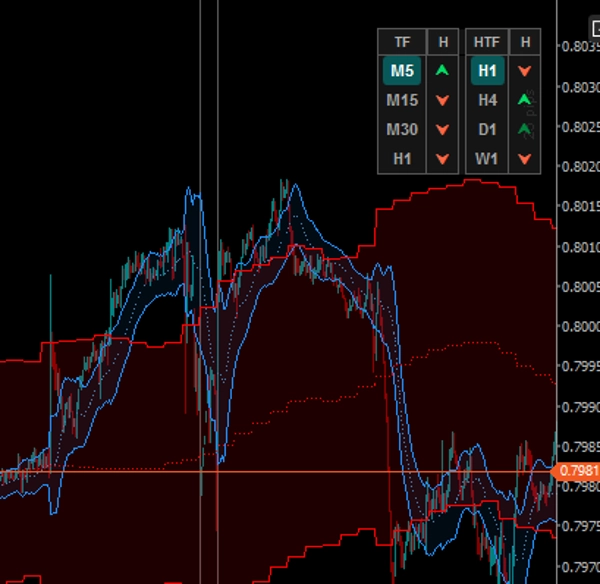
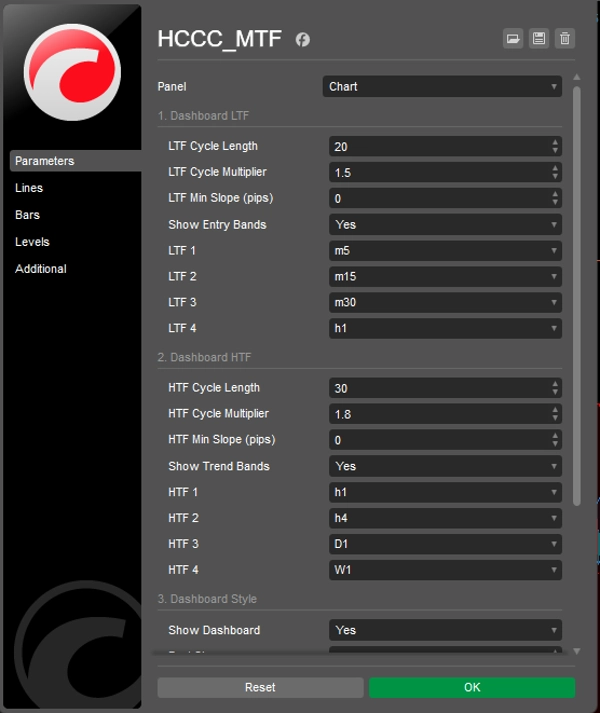
1. Interaktywny pulpit MTF (klikalny)
Zapomnij o przełączaniu się między wykresami. Pulpit na wykresie śledzi 4 niższe ramy czasowe (LTF) i 4 wyższe ramy czasowe (HTF).
- Przyciski LTF: Kliknij dowolny przycisk LTF, aby natychmiast zmienić ramę czasową bieżącego wykresu.
- Przyciski HTF: Kliknij dowolny przycisk HTF, aby natychmiast wyświetlić kanał tej konkretnej wyższej ramy czasowej bezpośrednio na bieżącym wykresie!
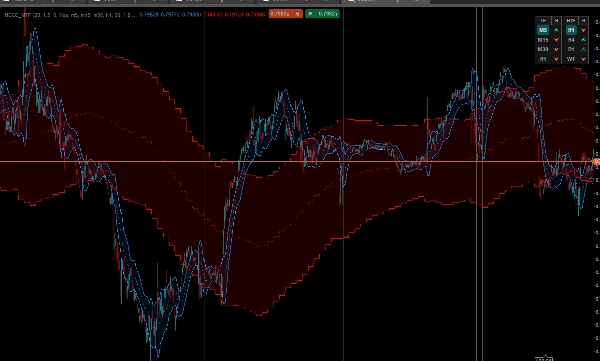
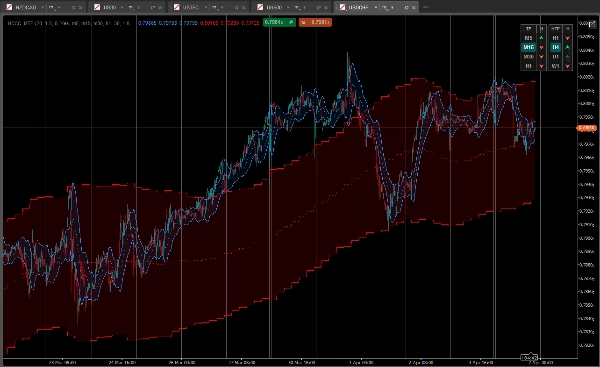
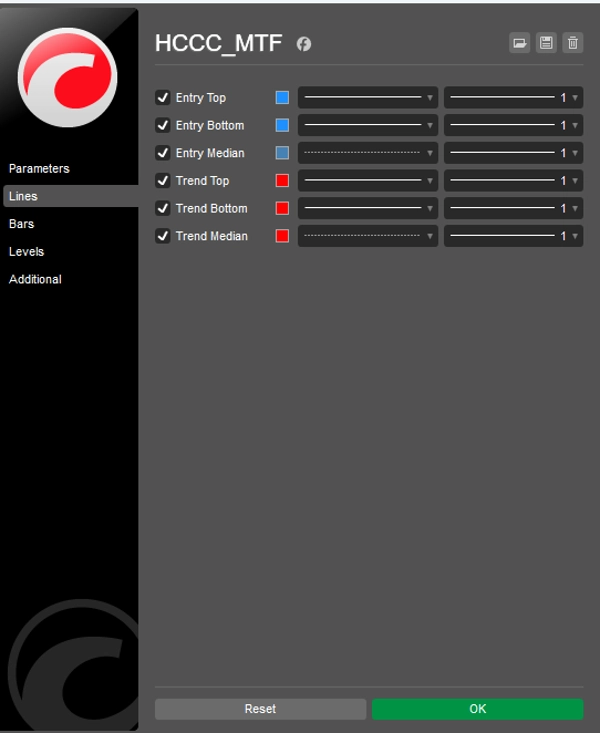
2. Podwójny system nakładania kanałów
Wskaźnik rysuje na wykresie dwa eleganckie, wypełnione chmurą kanały jednocześnie:
- Cykl wejścia (niebieska chmura): Oblicza cykl Hursta na podstawie ramy czasowej bieżącego wykresu.
- Cykl trendu (czerwona chmura): Kanał w widoku makro obliczony z wyższej ramy czasowej wybranej na pulpicie.
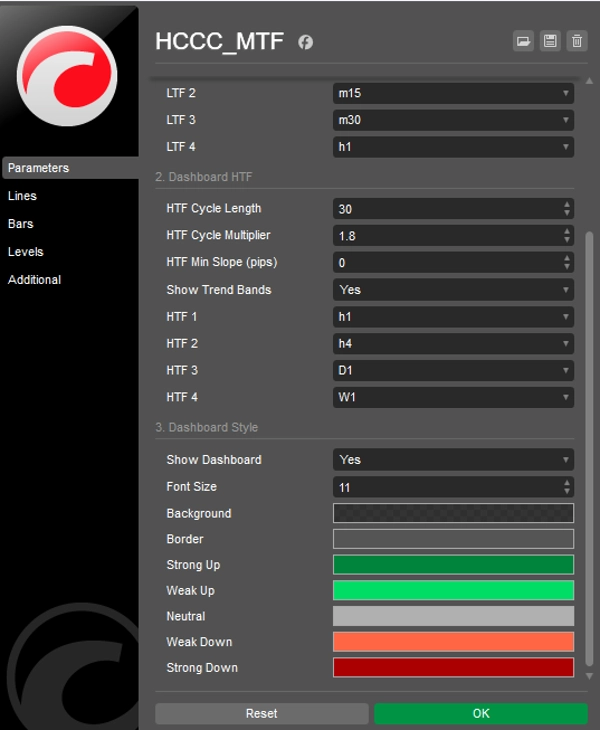
3. Zaawansowane 5-stanowe sygnały cykliczne
Pulpit nie pokazuje tylko kierunku trendu; pokazuje fazę cyklu, analizując nachylenie linii mediany oraz pozycję ceny względem pasm ATR.
- [ ⮝ ] Ciemnozielony (silny zakup): Nachylenie mediany jest W GÓRĘ, a cena spadła do dolnego pasma. To jest cykliczny dołek (kupuj na spadku).
- [ ⮝ ] Jasnozielony (słaby zakup): Trend jest W GÓRĘ, ale cena oscyluje wokół mediany lub górnego pasma.
- [ — ] Szary (neutralny): Cykl jest płaski. Brak wyraźnego momentum.
- [ ⮟ ] Jasnoczerwony (słaba sprzedaż): Trend jest W DÓŁ, ale cena jest blisko mediany.
- [ ⮟ ] Ciemnoczerwony (silna sprzedaż): Nachylenie mediany jest W DÓŁ, a cena wzrosła do górnego pasma. To jest cykliczny szczyt (sprzedaj na wzroście).
Jak używać go z cBotem "Follow The Trend XAU Edition"?
- Spójrz na prawą stronę pulpitu (kolumna HTF). Poczekaj na wyraźne wyrównanie na wyższych ramach czasowych (np. H4 i D1 pokazujące ciemno/jasnozielone strzałki).
- Spójrz na lewą stronę pulpitu (kolumna LTF), aby znaleźć lokalny cofnięcie (np. M15 pokazujące ciemnozieloną strzałkę "silny zakup").
- Gdy logika MTF się wyrówna, aktywuj swojego cBota Follow The Trend XAU Edition w kierunku "KUP" i pozwól jego algorytmom obsługiwać wejście, trailing stopy i zarządzanie ryzykiem.
Personalizacja
Wszystko jest w pełni konfigurowalne: długości cykli, mnożniki ATR, minimalna czułość nachylenia (w pipsach) do filtrowania szumów oraz pełna kontrola nad kolorami i pozycjonowaniem interfejsu użytkownika.
Pobierz go teraz ZA DARMO i przenieś swój półautomatyczny handel na wyższy poziom!
Podsumowanie
It overlays two cloud-filled channels: a blue "Entry Cycle" channel based on the current timeframe and a red "Trend Cycle" channel derived from a selected higher timeframe. The dashboard provides advanced five-state cyclic signals indicating strong or weak buy/sell conditions and neutral phases by analyzing the slope of the median line and price position relative to ATR bands.
The indicator is fully customizable, including cycle lengths, ATR multipliers, slope sensitivity, and UI appearance. It is intended to complement the "Follow The Trend XAU Edition" cBot by providing visual cycle and momentum analysis to guide semi-automated trade execution and management. The HCCC MTF supports various markets including Forex, commodities, indices, stocks, and cryptocurrencies.


![Logo „[CB] Pivot Points Pro”](https://cdn.ctrader.com/image/webp/43463c82-67b0-4f10-a4ba-901bba091d81_32594)