
Deskripsi
Zona Likuiditas Heatmap
Visualisasikan volume-per-harga, ungkap dukungan/penolakan tersembunyi, dan lacak likuiditas pasar secara real-time.
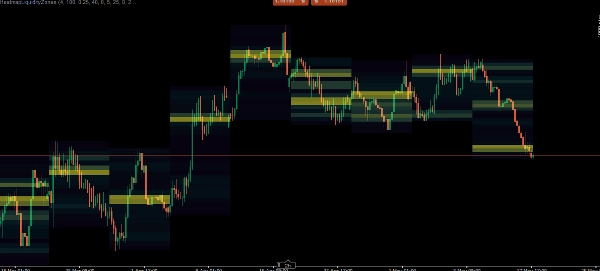
Indikator Zona Likuiditas Heatmap adalah alat profil volume yang kuat yang menerjemahkan data pasar mentah menjadi heatmap visual yang intuitif. Dengan menganalisis volume tick di berbagai kerangka waktu yang lebih tinggi (HTF), indikator ini mengidentifikasi dengan tepat di mana tekanan beli dan jual paling signifikan terkonsentrasi.
Alih-alih menebak di mana pasar mungkin berbalik, indikator ini memplot level likuiditas yang tepat dan didukung volume. Level-level ini meluas ke depan secara dinamis dan otomatis menghilang setelah harga menembus dan membatalkannya, menjaga grafik Anda tetap bersih dan relevan dengan aksi harga saat ini.
Fitur Utama
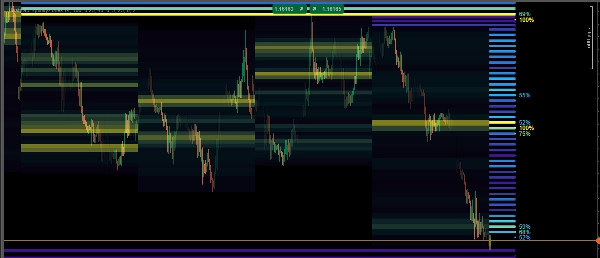
Heatmap Multi-Kerangka Waktu: Pilih kerangka waktu makro yang Anda inginkan (1H, 4H, Harian, Mingguan, atau Bulanan). Indikator akan memetakan distribusi volume untuk periode tersebut langsung ke grafik kerangka waktu yang lebih rendah.
Pengelompokan ATR Dinamis: Skala harga dipotong menjadi "bin" (zona) dinamis yang dihitung menggunakan Average True Range (ATR). Ini memastikan heatmap beradaptasi secara cerdas dengan pasar yang sangat volatil maupun yang terkonsolidasi rapat.
Level Likuiditas Otomatis Tidak Valid: Ketika sebuah bin harga tertentu mengakumulasi volume besar, itu menjadi "Level Likuiditas." Indikator menggambar garis solid yang meluas ke masa depan. Jika harga berhasil menembus level ini, garis tersebut otomatis dihapus (tidak valid).
Pewarnaan Gradien Kepadatan: Bedakan secara visual antara node volume Rendah, Sedang, dan Tinggi. Heatmap menggunakan gradien warna untuk menunjukkan dengan tepat di mana volume terberat terperangkap.
Pelacakan Persentase: Level likuiditas dengan kepadatan tinggi menampilkan label persentase (misalnya, 85%), menunjukkan seberapa kuat node tersebut relatif terhadap volume periode HTF lainnya.
Ringkasan
The indicator segments the price scale into dynamic zones based on the Average True Range (ATR), adapting to market volatility. It highlights significant volume clusters as liquidity levels with solid lines extending forward. These lines automatically disappear if the price breaks through the level, ensuring the chart remains focused on relevant, current price action.
A color gradient visually distinguishes low, medium, and high volume nodes, while percentage labels indicate the relative strength of high-density liquidity levels within the chosen timeframe. This tool supports traders in tracking market liquidity in real-time and making volume-backed decisions regarding support and resistance areas.
Ulasan pelanggan
5 | 100 % | |
4 | 0 % | |
3 | 0 % | |
2 | 0 % | |
1 | 0 % |


