
Deskripsi
Profil Likuiditas & Absorpsi Whale
Lacak uang institusional, analisis aliran pesanan, dan temukan zona pembalikan dengan presisi volumetrik
Profil Likuiditas & Absorpsi Whale bukan profil volume tradisional Anda. Ini adalah rangkaian analisis mikrostruktur pasar yang memecah setiap transaksi untuk menunjukkan tidak hanya di mana volume diperdagangkan, tetapi siapa yang memperdagangkannya (institusional vs. ritel) dan bagaimana harga berinteraksi pada level tersebut (agresi vs. absorpsi).
Ini menampilkan mesin rendering yang dioptimalkan yang memproyeksikan semua data di sebelah kanan harga saat ini, menjaga grafik Anda tetap bersih dan bebas lag.
Fitur Utama
- Filter Kekuatan (Hanya Whale): Menggunakan algoritma persentil (misalnya, 97% teratas) untuk memisahkan volume institusional ("Kuat") dari volume ritel ("Lemah"). Anda dapat mengaktifkan mode "Hanya Kuat" untuk secara eksklusif melacak jejak uang pintar.
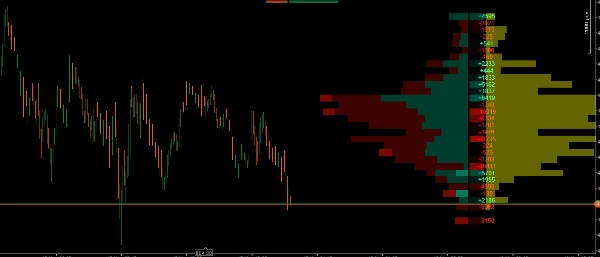
- Profil Volume Bertumpuk: Menampilkan secara visual distribusi volume bullish dan bearish per level harga, memudahkan identifikasi Titik Kontrol (POC) dan Node Volume Tinggi/Rendah (HVN/LVN).
- Deteksi Area Nilai Otomatis: Menyoroti level harga di mana persentase volume tertinggi telah diperdagangkan (default 70%), meredupkan zona luar untuk memudahkan membaca konteks pasar secara sekilas.
- Profil Delta (Peta Panas): Menghitung perbedaan tepat antara pembelian pasar dan penjualan pasar di setiap level harga. Termasuk nilai numerik dan peta panas visual untuk dengan cepat melihat siapa yang mengendalikan secara agresif.
- Profil Absorpsi (Zona Kuning): Mengukur volume yang terperangkap khususnya dalam sumbu lilin. Ini memungkinkan Anda melihat secara grafis di mana uang pintar secara pasif menyerap likuiditas dari trader ritel yang terperangkap.
- Performa Teroptimasi: Perhitungan volumetrik berat hanya diproses pada candle terbaru, memastikan platform cTrader Anda berjalan lancar dan efisien, bahkan pada timeframe yang lebih rendah.
Bagaimana cara menggunakan indikator ini dalam trading Anda?
Indikator ini menyediakan 3 lapisan konfirmasi untuk trading Anda. Berikut cara menggabungkannya secara efektif:
1. Tentukan Konteks dengan Profil Volume & Area Nilai
- Gunakan profil volume untuk mengidentifikasi di mana penerimaan harga paling tinggi (Area Nilai dan POC).
- Strategi: Cari peluang beli di bagian bawah Area Nilai (Support) dan peluang jual di bagian atas Area Nilai (Resistance).
2. Evaluasi Agresi dengan Profil Delta
- Saat harga mencapai level kunci Anda (misalnya, zona support), lihat kolom Delta.
- Strategi: Jika Anda mencari beli di support, Anda ingin melihat Delta yang sangat positif (hijau) pada level tersebut, menunjukkan pembeli masuk secara agresif. Jika Delta tetap sangat negatif, penjual masih mendominasi.
3. Temukan Pemicu Sempurna dengan Profil Absorpsi (Inti dari indikator)
- Di sinilah alat ini benar-benar bersinar. Seringkali, pasar tampak turun tajam (Delta negatif kuat), namun harga berhenti jatuh. Kenapa? Karena "whale" menggunakan order limit untuk menyerap semua tekanan jual tersebut.
- Strategi (Trading Pembalikan): Jika Anda melihat harga turun ke level kritis dan Delta negatif (penjual ritel terperangkap), tetapi tiba-tiba muncul bar kuning besar di Profil Absorpsi, itu berarti institusi baru saja menyerap semua likuiditas di sumbu tersebut. Ini adalah pemicu optimal Anda untuk masuk ke arah berlawanan!
4. Gunakan "Filter Kekuatan" untuk Memotong Kebisingan
- Jika pasar sedang berkonsolidasi dan arah tidak jelas, aktifkan opsi "Hanya Kuat". Ini akan menyembunyikan semua kebisingan ritel yang tidak relevan dan menunjukkan dengan tepat di mana dana besar sedang mengakumulasi atau mendistribusikan posisi mereka.
Ringkasan
A Delta Profile heatmap calculates the net difference between market buys and sells at each price level, showing buyer or seller aggression. The Absorption Profile identifies volume trapped in candlestick wicks, revealing where institutional traders absorb liquidity from retail participants. The indicator’s optimized engine processes heavy volumetric calculations only on the latest candle, ensuring smooth performance on the cTrader platform.
Traders can use this tool to define market context, evaluate buying or selling aggression, and pinpoint reversal triggers based on absorption patterns. The "Strong Only" mode filters out retail noise during consolidation phases, focusing on institutional accumulation or distribution zones. This indicator supports volume and DOM data visualization to enhance decision-making around key support and resistance levels.
Ulasan pelanggan
5 | 100 % | |
4 | 0 % | |
3 | 0 % | |
2 | 0 % | |
1 | 0 % |


