Deskripsi
Bias Struktur Heikin Ashi (Indikator cTrader)
Zona pasokan–permintaan otomatis dengan bias multi-timeframe.
Apa yang dilakukannya – dalam bahasa Inggris sederhana
Indikator ini secara otomatis:
- Membaca aksi harga Heikin Ashi dan mendeteksi pergeseran pivot yang berarti.
- Membangun zona support dan resistance dinamis di sekitar pivot tersebut, menggunakan baik ekstrem sumbu maupun badan candle (bukan hanya garis acak).
- Menggabungkan zona yang berdekatan secara cerdas sehingga Anda melihat level yang bersih dan dapat diperdagangkan, bukan hutan garis horizontal.
- Menghasilkan bias bullish atau bearish yang jelas kapan pun harga benar-benar menembus zona support atau resistance terbaru.
- Menunjukkan bias untuk:
-
- Timeframe grafik Anda, dan
- Timeframe lebih tinggi opsional (default H2) — tanpa menggambar kekacauan HTF di grafik Anda.
Hasil: dengan sekali lihat Anda tahu di mana level sebenarnya dan apakah pasar saat ini condong ke atas atau ke bawah.
Masalah yang diselesaikannya
Kebanyakan trader memiliki masalah yang sama:
- Garis support/resistance yang digambar manual adalah:
-
- subjektif,
- tidak konsisten,
- dan sering berlebihan.
- Indikator sederhana “zigzag + garis horizontal”:
-
- tidak menangani lebar zona dengan benar,
- menumpuk level di atas satu sama lain,
- atau memperluas zona sampai menutupi setengah grafik.
- Bias sering “ada di kepala Anda” – bukan sesuatu yang bisa Anda lihat jelas atau gunakan secara aturan.
Indikator ini dibuat untuk:
- Mengubah struktur Heikin Ashi menjadi zona yang jelas dan objektif,
- Memberi Anda trend/bias berbasis aturan berdasarkan zona tersebut,
- Sambil menjaga grafik bersih dan mudah dibaca.
Bagaimana zona dibangun (penjelasan ramah trader)
Untuk setiap pivot Heikin Ashi, indikator melihat struktur 3 candle:
- Ketika HA berbalik dari merah ke hijau, itu menandai pivot support.
- Ketika HA berbalik dari hijau ke merah, itu menandai pivot resistance.
Kemudian membangun zona:
Zona support
- Menemukan sumbu terendah di antara 3 candle (ekstrem sejati).
- Menemukan low terendah berikutnya yang masih lebih tinggi dari ekstrem itu.
- Menggunakan badan candle (open/close) dekat low dalam itu untuk mendefinisikan sisi “dapat diperdagangkan” dari zona.
- Zona support akhir:
-
- Bawah = sumbu low ekstrem,
- Atas = level dalam berbasis badan.
Zona resistance
- Menemukan sumbu tertinggi di antara 3 candle.
- Menemukan high tertinggi berikutnya yang masih lebih rendah dari ekstrem itu.
- Menggunakan badan dekat high dalam itu.
- Zona resistance akhir:
-
- Atas = sumbu high ekstrem,
- Bawah = level dalam berbasis badan.
Jadi setiap zona bukan hanya pita sembarangan:
Ini adalah rentang sumbu-ke-badan yang mewakili di mana harga benar-benar ditolak atau berbalik.
Logika penggabungan (mengapa grafik tetap bersih)
Zona dengan tipe yang sama (support dengan support, resistance dengan resistance):
- Diperlakukan sebagai unit pada garis waktu.
- Hanya bisa bergabung jika benar-benar tumpang tindih dalam harga.
- Penggabungan bersifat lokal:
-
- Zona baru dapat bergabung dengan:
-
- zona terbaru (berdampingan), atau
- zona kedua terbaru (+1 celah), dan
- Satu penggabungan “jangkar” tambahan di belakang itu jika zona gabungan baru sekarang tumpang tindih dengan struktur sebelumnya.
Ini menjaga perilaku tetap intuitif:
- Zona tidak “menelan” seluruh sejarah.
- Level lama dihormati tapi tidak diizinkan membuat mega-zona raksasa.
- Struktur lokal seperti A–B–C atau A–C+D ditangani dengan cara yang terkendali.
Logika bias (bagaimana Anda benar-benar berdagang dengannya)
Untuk setiap timeframe (utama dan HTF):
- Indikator melacak zona support gabungan terbaru dan zona resistance gabungan terbaru.
- Kemudian, pada setiap candle yang tertutup:
-
- Jika harga menutup di atas zona resistance terbaru → bias menjadi Bullish.
- Jika harga menutup di bawah zona support terbaru → bias menjadi Bearish.
Indikator menyimpan:
- Waktu terakhir bias berubah,
- Level harga saat harga menembus zona.
Di grafik, panel teks kecil menunjukkan:
Bias Utama (H1): BullishPerubahan Utama (H1): 11/26 15:00 @1.08750
Jika HTF diaktifkan, Anda juga akan melihat sesuatu seperti:
Bias HTF (H2): BearishPerubahan HTF (H2): 11/25 08:00 @1.09200
Anda juga dapat mengaktifkan peringatan suara saat bias timeframe utama berubah.
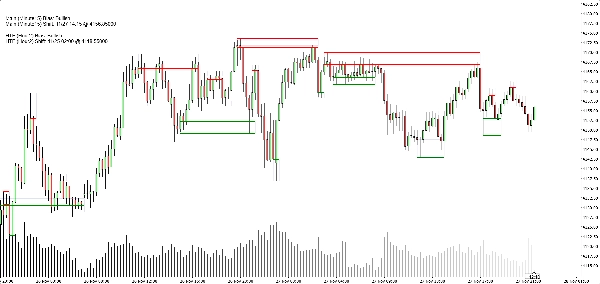
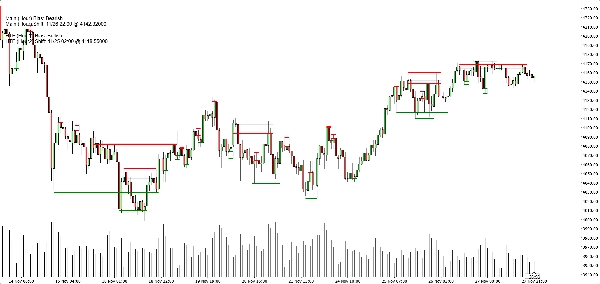
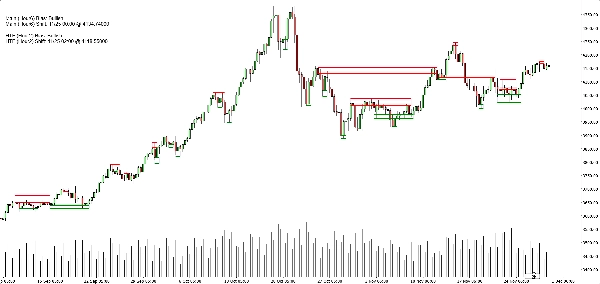
Apa yang Anda lihat di grafik
- Zona support:
-
- Garis dasar/trigger horizontal hijau (opsional),
- Sebuah persegi panjang navy lembut (opasitas sangat rendah) yang menunjukkan pita support penuh.
- Zona resistance:
-
- Garis merah + persegi panjang navy lembut untuk pita.
- Tombol tampilan bersih:
-
- Tampilkan/sembunyikan zona support,
- Tampilkan/sembunyikan zona resistance,
- Nyalakan/matikan persegi panjang terisi,
- Nyalakan/matikan garis dasar/trigger,
- Nyalakan/matikan panel bias.
Ini memungkinkan trader berbeda memilih antara:
- Tampilan yang lebih minimalis (mungkin hanya persegi panjang), atau
- Tampilan yang lebih presisi (garis tepat terlihat).
Kasus penggunaan tipikal
Anda dapat memposisikannya berguna untuk:
- Penyaringan tren
-
- Hanya cari beli ketika kedua bias TF utama dan HTF adalah Bullish.
- Hanya cari jual ketika keduanya Bearish.
- Entri zona
-
- Gunakan zona sebagai area minat untuk:
-
- Limit order,
- Entri konfirmasi (misalnya harga kembali ke zona yang telah ditembus dan ditolak lagi),
- Penempatan stop tepat di luar pita luar.
- Analisis top-down
-
- Bias HTF (H2 secara default) sebagai gambaran besar,
- Bias TF grafik untuk timing,
- Zona untuk level eksekusi konkret.
Apa yang BUKAN (penting untuk penjualan jujur)
- Ini bukan robot yang berdagang otomatis untuk Anda.
- Ini bukan sinyal “holy grail” yang menjamin keuntungan.
- Ini adalah mesin struktur dan bias:
-
- Mendefinisikan zona secara objektif,
- Mendefinisikan trend/bias secara objektif berdasarkan zona tersebut,
- Meninggalkan manajemen perdagangan aktual kepada trader/strategi.
Ringkasan
Ulasan pelanggan
5 | 33 % | |
4 | 67 % | |
3 | 0 % | |
2 | 0 % | |
1 | 0 % |