


Deskripsi
IDE
Rata-rata bergerak yang menyesuaikan dengan perkembangan tren daripada memaksa tren ke dalam periode tetap.
MASALAH
Sebagian besar rata-rata bergerak memerlukan periode lihat ke belakang yang tetap.
Tetapi tren tidak berkembang dalam durasi tetap.
Periode pendek bereaksi cepat, tetapi mudah terganggu oleh pergerakan jangka pendek.
Periode panjang meredam lebih banyak noise, tetapi bisa tertinggal parah saat harga bergerak kuat.
Masalahnya bukan memilih periode “yang tepat”.
Masalahnya adalah periode itu sendiri tetap sementara tren terus berkembang.
KONSEP INTI: TREN MENENTUKAN PERIODE. MA MENYESUAIKAN DIRINYA.
Rata-rata bergerak tradisional menjadikan periode sebagai referensi utama.
Supertrend Moving Average menjadikan struktur tren sebagai referensi utama.
Alih-alih bertanya:
“Periode MA tetap mana yang harus saya gunakan?”
indikator bertanya:
“Bagaimana perkembangan tren saat ini sejauh ini?”
Tren menentukan di mana MA adaptif dimulai dan bagaimana panjang efektifnya berkembang seiring waktu.
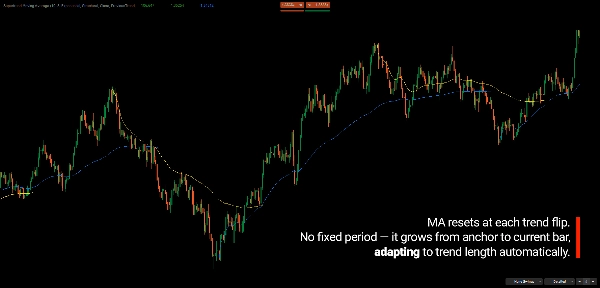
Ketika tren baru dimulai, MA dipasang pada ekstrem struktural tren sebelumnya dan berkembang maju dari titik itu. Saat tren baru berlanjut, periode efektif tumbuh dengan jumlah bar yang telah berkembang dari jangkar tersebut.
Tren menetapkan struktur. MA menyesuaikan diri dengannya.
APA YANG DILAKUKANNYA
Indikator secara dinamis menyesuaikan panjang MA efektifnya sesuai dengan perkembangan tren saat ini.
Tren yang baru diidentifikasi dimulai dengan panjang efektif yang lebih pendek, memungkinkan MA merespons lebih cepat.
Saat tren berlanjut, panjang efektif menjadi lebih panjang, memungkinkan MA menjadi semakin halus.
MA tidak hanya dihitung dari sejumlah bar terbaru yang tetap. Perhitungannya berkembang dari jangkar struktural yang ditetapkan oleh tren sebelumnya.
Ketika tren berubah, referensi struktural direset dan pengukuran adaptif baru dimulai.
Ini menciptakan rata-rata bergerak yang mengubah perilakunya sesuai dengan apa yang telah dilakukan tren.
Ini tidak mencoba memprediksi berapa lama tren berikutnya akan berlangsung.
Ini menyesuaikan dengan durasi dan struktur yang sudah berkembang.
BAGAIMANA CARANYA BEKERJA
- Supertrend mengidentifikasi tren saat ini dan transisi strukturalnya.
- Indikator mengidentifikasi penutupan ekstrem tren sebelumnya.
- Ekstrem struktural itu menjadi jangkar untuk MA adaptif.
- Saat tren baru berkembang, jumlah bar dari jangkar menentukan panjang efektif MA.
- MA menghitung ulang menggunakan panjang yang berkembang itu.
- Ketika tren berubah, referensi struktural direset dan proses dimulai lagi.
Panjang adaptif dapat digabungkan dengan metode perhitungan rata-rata bergerak yang berbeda.
DUA PANDANGAN TENTANG TREN
Indikator menyediakan dua referensi Supertrend:
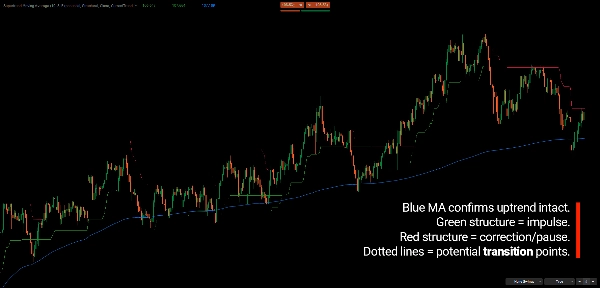
Supertrend Struktural
Referensi tren yang lebih luas dirancang untuk menangkap perubahan struktural yang lebih besar sambil kurang sensitif terhadap volatilitas harga jangka pendek.
Supertrend Asli
Referensi yang lebih reaktif yang merespons lebih cepat terhadap pergerakan harga dan dapat mengungkap pergeseran momentum jangka pendek dalam tren yang lebih luas.
Kedua pandangan ini tidak dimaksudkan sebagai sinyal otomatis.
Hubungan mereka memberikan konteks tambahan tentang bagaimana tren berkembang.
Ketika kedua referensi bergerak bersama, mereka memberikan pandangan yang lebih jelas tentang keselarasan arah.
Ketika mereka menyimpang, perbedaan tersebut dapat memberikan konteks untuk koreksi, transisi, atau pergerakan jangka pendek dalam tren yang lebih luas.
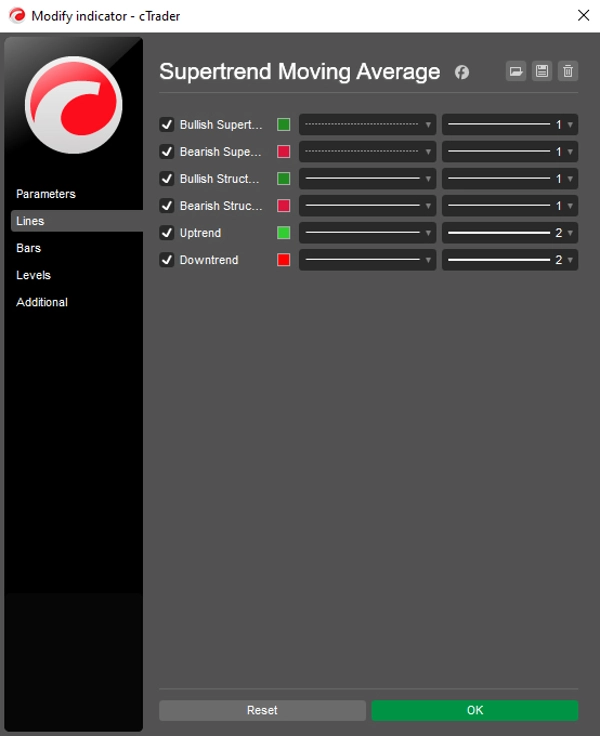
Supertrend Asli (bertitik) hanya digambar pada bar di mana berbeda dari yang Struktural, sehingga divergensi terlihat jelas. Setiap pandangan dapat ditampilkan atau disembunyikan secara independen.
KONTEKS MULTI-TIMEFRAME
Tren yang digunakan untuk mengontrol MA tidak harus berasal dari timeframe grafik saat ini.
Misalnya, tren Harian dapat mengontrol rata-rata bergerak adaptif yang ditampilkan pada grafik H1.
Ini memungkinkan tren timeframe lebih tinggi untuk menentukan perilaku pengukuran sementara timeframe lebih rendah memberikan pandangan yang lebih rinci tentang perkembangan harga.
Multi-timeframe (MTF) mencakup tiga output, masing-masing dapat diaktifkan atau dimatikan secara independen:
- Moving Average – MA adaptif didorong oleh tren HTF.
- Supertrend – Supertrend Struktural dan Asli dihitung pada bar HTF dan dipetakan ke grafik. Mereka diperbarui pada setiap tick saat bar HTF masih terbentuk.
- Swing Points – ayunan dan S/R otomatis dihitung pada bar HTF. Penanda berada pada ekstrem harga aktual di dalam bar HTF, dan sapuan, pembalikan, serta invalidasi dievaluasi saat bar HTF ditutup. Label S/R dan titik akhir garis masih diperbarui pada setiap bar grafik.
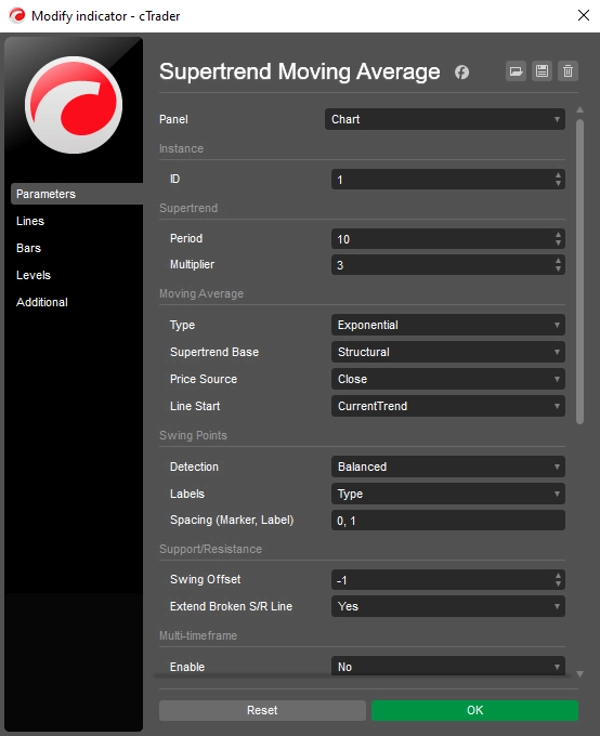
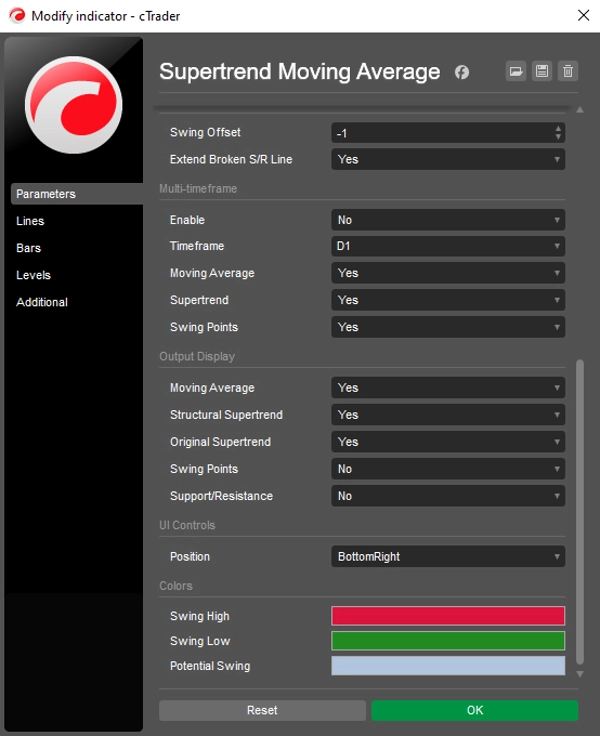
Grup parameter Multi-timeframe berisi Enable, Timeframe, dan satu saklar masing-masing untuk Moving Average, Supertrend, dan Swing Points. MTF mati secara default; setelah diaktifkan, ketiga output menggunakan timeframe yang dipilih kecuali Anda mematikannya secara individual.
Timeframe MTF bisa lebih tinggi, sama dengan, atau lebih rendah dari timeframe grafik. Ketika lebih rendah atau sama dengan timeframe grafik, setiap bar grafik menggunakan bar HTF terakhir di dalamnya (nilai saat penutupan bar grafik), dan penanda ayunan berada pada bar grafik yang berisi pembukaan bar HTF.
Catatan: MA HTF mengevaluasi setiap bar HTF saat pertama kali muncul, jadi tidak berubah saat bar itu masih terbentuk.
PEMUATAN RIWAYAT OTOMATIS
MA HTF membutuhkan cukup riwayat grafik untuk membangun kembali tren timeframe lebih tinggi. Ketika grafik memiliki terlalu sedikit bar, indikator secara otomatis meminta lebih banyak riwayat dan mengulangi hingga kebutuhan terpenuhi.
Peringatan di grafik ("Load N more bars") muncul hanya sebagai upaya terakhir: ketika tidak ada riwayat lagi yang tersedia, permintaan terakhir tidak menambah apa pun, permintaan timeout, atau kebutuhan sangat besar.
KONTEKS AYUNAN OPSIONAL
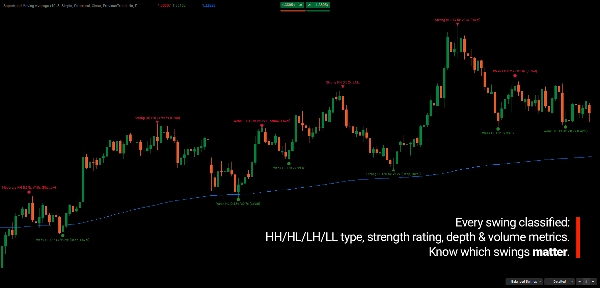
Indikator juga dapat menampilkan informasi ayunan seperti:
- HH / HL / LH / LL
- Kekuatan ayunan
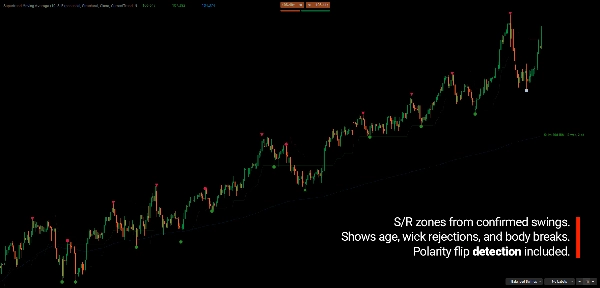
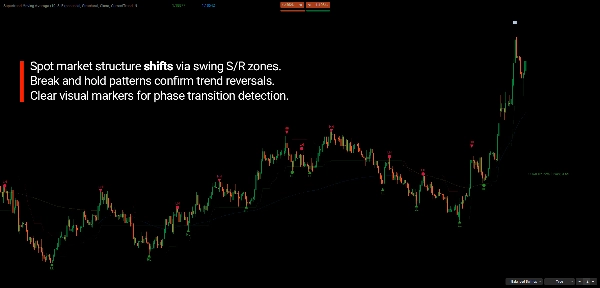
- Zona ayunan dan Support/Resistance otomatis
- Polaritas ayunan
- Hubungan ayunan
Ini memberikan geometri harga tambahan di sekitar MA adaptif tanpa mengubah perhitungan intinya.
Swing Points dan S/R dapat diaktifkan atau dimatikan secara independen (S/R memerlukan Swing Points). Pilihan S/R Anda tetap saat Swing Points mati dan berlaku kembali saat Anda mengaktifkannya kembali.
TAMPILAN OUTPUT
Pilih tepat apa yang digambar: MA, Supertrend Struktural, Supertrend Asli, Ayunan, dan Support/Resistance. Secara default MA, Struktural, dan Asli aktif; Ayunan dan S/R mati.
- Menyembunyikan output juga melewati perhitungannya. Dengan MA mati, semua pekerjaan MA (native dan HTF, termasuk pemuatan bar HTF) dilewati; dengan Ayunan mati, deteksi dan rendering ayunan dilewati.
- Supertrend Asli yang bertitik tetap muncul hanya di tempat berbeda dari yang Struktural, bahkan saat garis Struktural disembunyikan.
- Offset Ayunan berkisar dari -100 hingga -1 (default -1). Menampilkan atau menyembunyikan S/R dikontrol oleh saklar S/R.
KONTROL DI GRAFIK
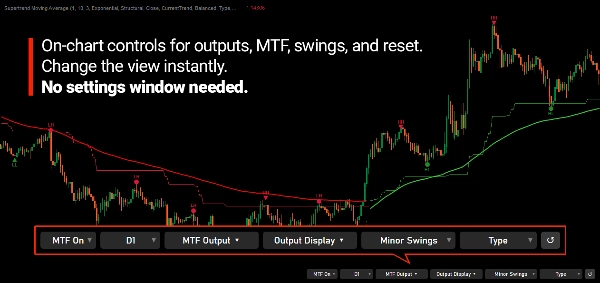
Ubah apa yang Anda lihat tanpa membuka kembali dialog parameter:
- Tampilan Output – kotak centang untuk MA, Supertrend Struktural, Supertrend Asli, Ayunan, dan Support/Resistance. Setidaknya satu dari MA, Supertrend Struktural, Supertrend Asli, atau Ayunan tetap dicentang.
- MTF – On/Off, timeframe HTF, dan Output MTF (MA, Supertrend, Ayunan; setidaknya satu tetap dicentang). Perubahan berlaku segera, tanpa memuat ulang indikator: MA, Supertrend, dan ayunan dibangun ulang sesuai kebutuhan.
- Kontrol Ayunan – mode deteksi, tampilan label, dan offset S/R. Saat Ayunan mati, mereka disembunyikan dan objek ayunan serta S/R dihapus dari grafik; tombol offset muncul hanya saat Ayunan dan S/R aktif.
- Tombol Reset (↺) – mengembalikan setiap kontrol, termasuk MTF dan kontrol ayunan, ke nilai dialog parameter.
- Pengaturan tersimpan – pilihan di grafik (termasuk MTF dan kontrol ayunan) disimpan per simbol dan Instance ID dan dipulihkan saat berikutnya. Jika Anda mengubah parameter di dialog, nilai itu lebih diutamakan daripada yang tersimpan.
- Instance ID – gunakan ID berbeda untuk menjaga pengaturan terpisah untuk beberapa instance pada simbol yang sama.
- Pengalihan – mengaktifkan MA membangunnya kembali (native dan HTF) dan mematikannya menghapusnya. Mengalihkan salah satu Supertrend hanya menyegarkan outputnya sendiri.
APA YANG BISA ANDA AMATI
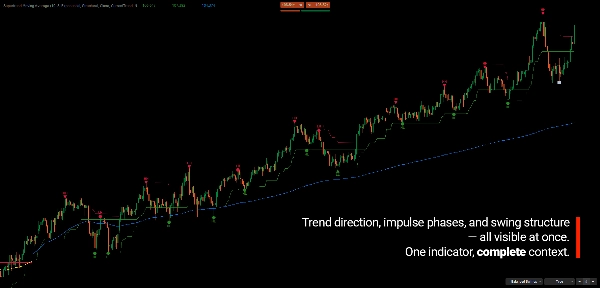
Indikator dirancang untuk membuat beberapa hal terlihat:
- Arah tren saat ini
- Durasi tren
- Perubahan dalam struktur tren
- Tarikan kembali dan koreksi
- Kelanjutan setelah koreksi
- Konteks timeframe lebih tinggi
- Perubahan perilaku harga di sekitar rata-rata adaptif
MA adalah alat pengukuran, bukan sistem beli/jual mandiri.
DIBUAT UNTUK PENGUKURAN ADAPTIF
Tujuannya bukan untuk menemukan satu periode MA yang sempurna.
Ini untuk menghilangkan asumsi bahwa satu periode tetap harus tetap sesuai sepanjang umur tren.
Tren baru dan tren matang adalah tahap berbeda dari gerakan yang sama.
Rata-rata bergerak menyesuaikan dengan perkembangan itu daripada memperlakukan kedua tahap sama.
Tujuannya bukan untuk terus mengoptimalkan periode MA tetap. Periode berkembang secara otomatis dari struktur tren dan pergerakan harga yang sudah terjadi.
FITUR UTAMA
- MA adaptif berbasis struktur tren
- Jangkar struktural berdasarkan penutupan ekstrem tren sebelumnya
- Panjang MA efektif berkembang dengan tren baru
- Reset struktural otomatis saat tren berubah
- Beberapa metode perhitungan MA
- Tampilan Supertrend Struktural
- Tampilan Supertrend Asli
- Konteks antara pandangan tren struktural dan reaktif
- Informasi ayunan opsional dan S/R otomatis
- Klasifikasi HH / HL / LH / LL
- Kekuatan dan zona ayunan
- Multi-timeframe untuk MA, Supertrend, dan Swing Points, masing-masing independen
- HTF bisa lebih rendah, sama dengan, atau lebih tinggi dari timeframe grafik
- Supertrend HTF langsung saat bar HTF terbentuk
- Kontrol Tampilan Output dan MTF langsung di grafik
- Tombol reset, pengaturan tersimpan, dan Instance ID
- Pemuatan riwayat grafik otomatis untuk MA HTF
- Tampilan yang dapat disesuaikan
BAIK UNTUK DIKETAHUI
- MA HTF mengevaluasi setiap bar HTF sekali, saat pertama kali muncul, jadi tidak berubah saat bar itu masih terbentuk. Supertrend HTF diperbarui secara langsung.
- Peringatan "Load N more bars" dan pemuatan riwayat otomatis hanya berlaku untuk MA HTF.
- Jarak ayunan adalah nilai pip tetap, jadi pada ayunan HTF offset penanda mungkin terlihat kecil.
- Perhitungan ulang ayunan berjalan di thread UI, jadi grafik dengan riwayat sangat panjang mungkin membeku sebentar saat ayunan dihitung ulang.
- Ayunan yang dipangkas dari riwayat 100 ayunan tetap menyimpan objek grafiknya.
---
Indikator ini adalah alat untuk analisis pasar dan tidak memberikan nasihat keuangan atau menjamin hasil perdagangan.
Ringkasan
The indicator integrates dual Supertrend analyses: a Structural Supertrend that identifies major trend direction by filtering out noise and confirming genuine directional changes, and the Original Supertrend that highlights momentum shifts within the trend. Comparing these two provides context for distinguishing strong trend continuation from corrective movements.
Key features include:
- Adaptive anchor-based moving averages with options for Simple, Exponential, or Arnaud Legoux (ALMA) types.
- Multi-timeframe capability to apply higher timeframe Supertrend context on lower timeframe charts.
- Integrated swing detection with configurable modes and strength classification.
- Color-coded trend lines and swing markers for clear visual interpretation.
This tool is suited for trend and swing traders, multi-timeframe analysts, and discretionary traders seeking a structural framework to track trend development and market rhythm objectively. It emphasizes market structure and context over fixed signals, supporting clearer interpretation of price behavior.
Ulasan pelanggan
5 | 67 % | |
4 | 33 % | |
3 | 0 % | |
2 | 0 % | |
1 | 0 % |
Diskusi
Pertanyaan umum






![Logo "[Hamster-Coder] Moving Average MTF"](https://cdn.ctrader.com/image/webp/b11b98b1-194d-4b8e-b00e-d611826ad159_31226)














Harga