
설명
우리는 👉 PrimeQuant
🚫🚫🚫 이 지표를 구매하지 마세요!
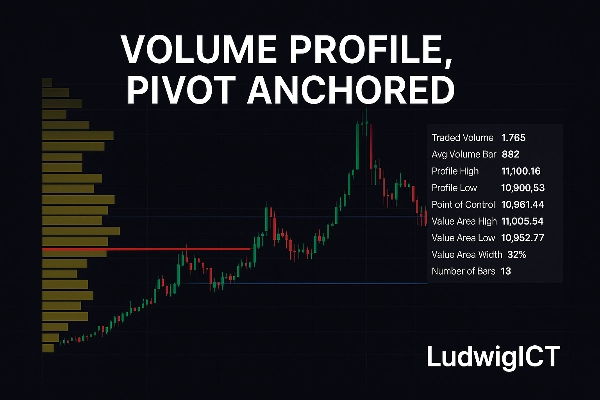
Volume Profile, Pivot Anchored 지표는 전문적인 수준의 시장 구조 및 거래량 분석을 cTrader에 직접 제공합니다. 명확성, 정밀성, 실행 가능한 통찰력을 중시하는 트레이더를 위해 설계되었으며, 의미 있는 스윙 범위 내에서 가격별 거래 활동 분포를 보여줍니다.
⚡독점 제안 – 최초 10명 구매자 한정!⚡
이 강력한 맞춤형 지표로 거래 전략의 잠재력을 최대한 활용하세요. 시장에서 정확한 우위를 제공하도록 설계된 이 도구는 명확하고 실행 가능한 신호와 XAU/USD 및 기타 외환 페어 거래 시 향상된 의사결정을 원하는 진지한 트레이더를 위해 제작되었습니다.
🚀 지금 구매해야 하는 이유:
최초 10명의 트레이더만을 위한 특별 출시 가격로 제공됩니다.
고급 가격 행동 통찰력에 접근하세요
높은 정확도와 신뢰성을 위해 설계되었습니다
스캘핑과 스윙 트레이딩 모두에 완벽합니다
10개가 판매되면 이 제안은 이 가격으로 더 이상 제공되지 않습니다. 오늘 바로 복사본을 확보하고 거래를 한 단계 끌어올리세요!
무엇을 하나요?
고정되거나 세션 기반 프로필과 달리, 이 도구는 중요한 피벗 고점과 저점에 자동으로 볼륨 프로필을 고정하여 각 스윙의 경매 과정을 동적으로 매핑합니다. 이를 통해 시장 참여자들이 실제로 자본을 투입한 위치를 볼 수 있습니다 — 단순히 가격이 움직인 위치가 아닙니다.
✨ 주요 요소는 다음과 같습니다:
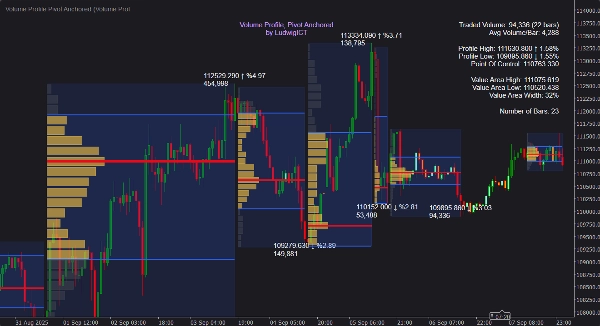
📍 자동 피벗 감지 – 프로필은 스윙 고점과 저점 사이에 구축되며, 새로운 피벗이 형성될 때마다 업데이트됩니다.
📊 상세한 거래량 분포 – 히스토그램은 사용자 정의 해상도와 너비로 가격별 거래량 할당을 표시합니다.
🎯 가치 영역 및 POC 레벨 – 제어점(POC), 가치 영역 고가(VAH), 가치 영역 저가(VAL)를 즉시 계산하고 시각화합니다.
📈 개발 중인 프로필 – 현재 구간에 대한 실시간 업데이트 프로필로 미래 지향적 맥락을 제공합니다.
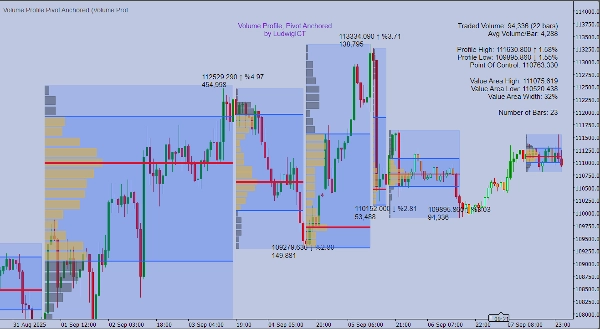
➡️ POC 영역 확장 – 가격이 닿거나 교차할 때까지 POC를 앞으로 투사하여 미래 반응 구역을 강조합니다.
📝 유용한 라벨 및 툴팁 – 가격 라벨, % 변화, 누적 거래량, 마우스 오버 시 깔끔한 통계 패널 제공.
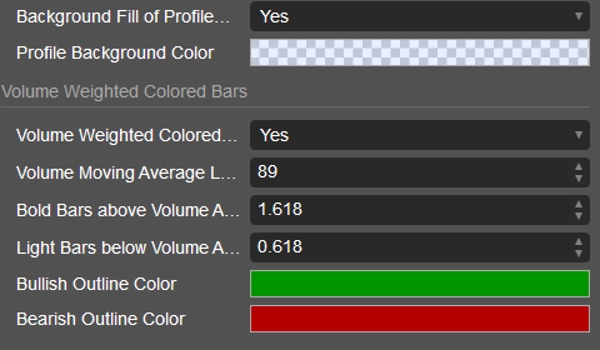
🎨 거래량 가중 막대 색상 – 거래량 강도에 따라 캔들을 음영 처리하여 빠른 패턴 인식 가능.
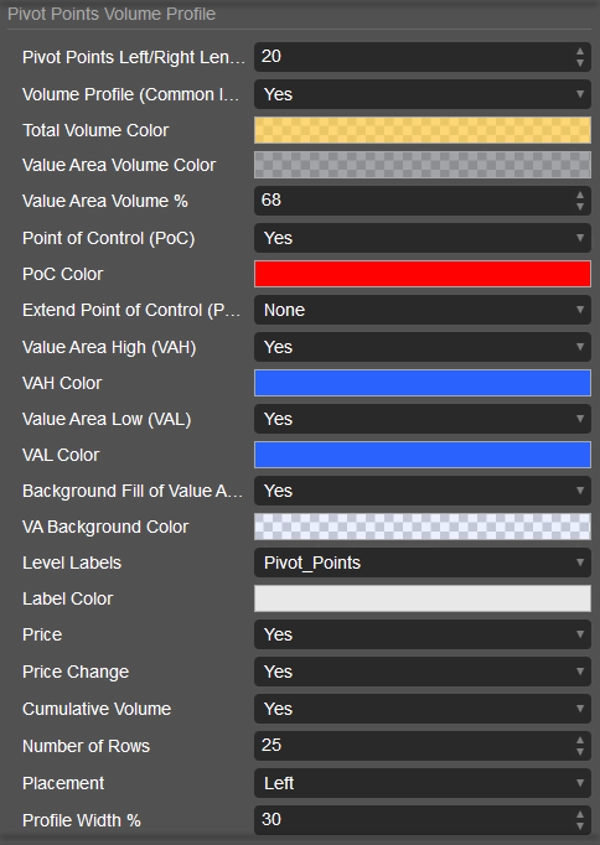
⚙️ 완전한 사용자 지정 – 색상, 위치, 표시 방식을 조정하여 차트 스타일과 완벽하게 통합할 수 있습니다.
사용 방법
1️⃣ 모든 차트에 부착 – 모든 시간대와 상품에서 작동합니다.
2️⃣ 피벗 길이 조정 – 스윙 고점/저점에 대한 민감도를 제어합니다 (짧게 설정하면 프로필이 더 많아지고, 길게 설정하면 주요 구조만 표시).
3️⃣ 프로필을 맥락에서 해석:
• 🎯 POC – 가장 많이 거래된 가격 수준으로, 종종 자석 역할을 합니다.
• 📏 VAH / VAL – 가치 영역의 경계로, 강력한 지지/저항 역할을 합니다.
• 🌀 히스토그램 모양 – 균형 영역, 거부 구역, 분포 변화를 식별합니다.
4️⃣ 개발 중인 프로필 관찰 – 경매 구조가 실시간으로 어떻게 구축되는지 따라가세요.
5️⃣ 알림 사용 – 가격이 POC, VAH, VAL과 상호작용하거나 고거래량 막대가 나타날 때 알림을 받으세요.
6️⃣ 프레임워크로 적용 – 거래량 기반 레벨에서 진입을 정제하고, 반전을 예상하며, 거래량 구조를 통해 추세를 확인하세요.
트레이더들이 사용하는 이유
이 지표는 원시 거래량을 의미 있는 구조로 변환합니다. 피벗에 프로필을 고정함으로써 임의의 세션 분할에 의존하지 않고 실시간 시장 역학에 적응합니다. 일중, 스윙, 포지션 트레이딩에 관계없이 고정된 거래량 분포는 의사결정에 더 깊은 명확성을 제공합니다.
주요 매개변수 한눈에 보기
⚙️ 피벗 민감도 – 스윙 포인트 감지 강도를 정의합니다.
📊 프로필 레벨 및 너비 – 프로필 해상도와 가시성을 제어합니다.
🎯 POC 확장 모드 – 없음, 마지막 바까지, 닿을 때까지, 또는 교차할 때까지.
📏 가치 영역 % – 완전 조정 가능 (기본값 68%).
🎨 거래량 색상 – 강한/약한 참여를 강조하는 임계값.
LudwigICT의 Volume Profile, Pivot Anchored는 일반적인 시각화가 아니라 시장이 실제로 어떻게 경매되는지에 대한 구조적 렌즈입니다. 전문 도구를 요구하는 트레이더에게 가격과 거래량 간 상호작용을 읽는 결정적인 우위를 제공합니다.
질문이 있거나 문제가 발생하면 언제든지 연락하세요. 기꺼이 도와드리겠습니다!
면책 조항:
제 알고리즘을 사용함으로써 거래에는 고유한 위험이 수반되며 과거 성과가 미래 결과를 보장하지 않는다는 점을 인정하는 것입니다. 견고한 위험 관리 전략을 갖추고 무엇보다도 손절매 수준을 엄격히 준수하는 것이 필수적입니다. 위험을 제대로 관리하지 않으면 상당한 손실이 발생할 수 있습니다. 저는 이 알고리즘 사용으로 인한 재정적 결과에 대해 책임지지 않습니다. 책임감 있게 거래하고 항상 적절한 위험 관리 관행을 따르십시오.
행운을 빕니다! 🙌
요약
고객 리뷰
5 | 67 % | |
4 | 33 % | |
3 | 0 % | |
2 | 0 % | |
1 | 0 % |


