
Penerangan
⚠️ Kami telah berpindah ke 👉 PrimeQuant
🚫🚫🚫 Jangan beli penunjuk ini!
⚡ VERSI GENERASI SETERUSNYA TERSEDIA: Alat klasik LudwigICT ini telah direka semula, distruktur semula, dan dikeluarkan semula di bawah jenama pembangun baru kami, PrimeQuant. Versi baru ini menampilkan antara muka pengguna yang dipermudahkan dan sifat yang dikemas kini untuk keadaan pasaran semasa. Dapatkan versi yang dinaik taraf dengan harga diskaun di sini:
👉 Matrix Pro oleh PrimeQuant
👉 Matrix Pro oleh PrimeQuant
👉 Matrix Pro oleh PrimeQuant
(Sila ambil perhatian: Penyenaraian LudwigICT kekal aktif untuk pengguna warisan tetapi tidak akan menerima kemas kini atau diskaun harga aktif lagi.)
📈 Tingkatkan perdagangan anda dengan ketepatan, struktur, dan alat profesional.
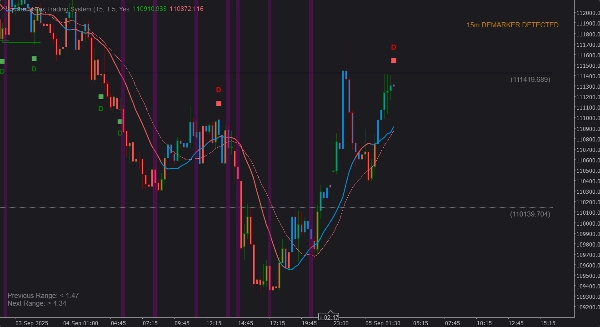
Sistem Perdagangan Square Matrix adalah satu suite berkualiti tinggi dan bertaraf institusi yang direka untuk memberikan pedagang kejelasan tiada tandingan dalam menganalisis tindakan harga.
Penunjuk serba boleh ini menggabungkan dengan lancar lima metodologi perdagangan maju, menggabungkan teknik yang diinspirasikan oleh alat institusi teratas TradingView, kini dioptimumkan sepenuhnya untuk cTrader Automate (cAlgo).
Dibina untuk pedagang yang menuntut kelajuan, ketepatan, dan persembahan visual yang bersih, Square Matrix menghapuskan tekaan dan memberikan pengalaman perdagangan bertaraf profesional untuk Forex, indeks, saham, dan kripto.
✨ Ciri Utama
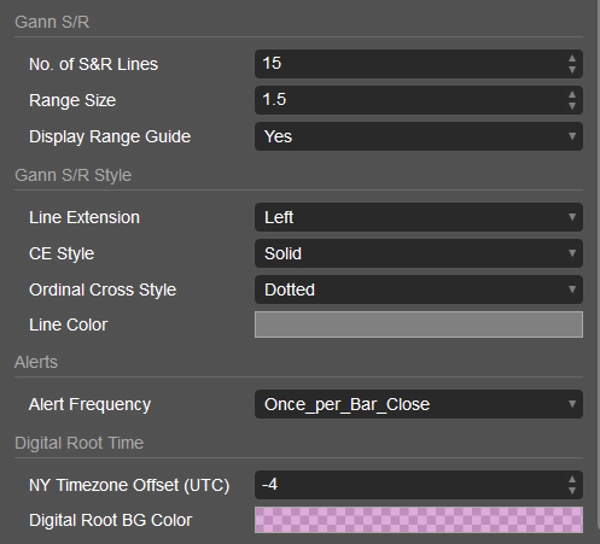
1. Sokongan & Rintangan Gann Square of 9
Tahap S/R berasaskan Gann yang dinamik dan adaptif yang sentiasa berkembang mengikut tindakan harga.
Tahap ini menyediakan struktur grid gaya institusi, membantu pedagang mengenal pasti zon reaksi tepat, titik pecahan, dan kawasan perubahan dengan mudah.
2. Pengesanan Masa Akar Digital
Algoritma berasaskan masa unik yang menyerlahkan tingkap masa kritikal di mana harga secara statistik lebih cenderung untuk berbalik, mempercepat, atau mengukuh.
Sesuai untuk meramalkan kemasukan berkemungkinan tinggi sebelum pasaran bergerak.
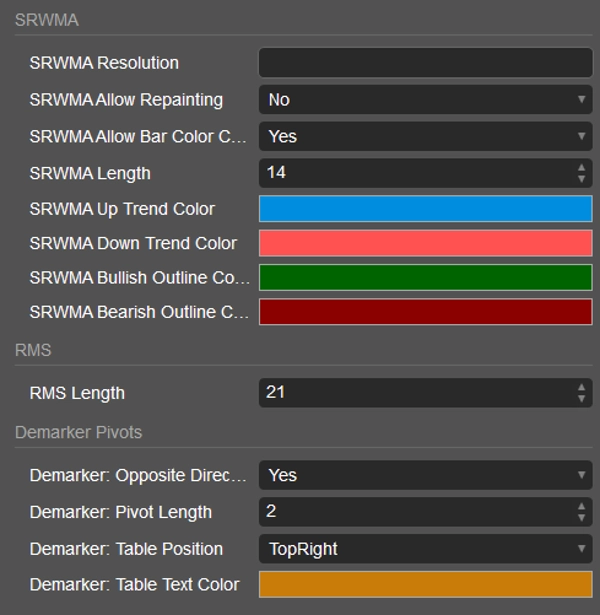
3. SRWMA – Purata Pergerakan Berbobot Akar Licin
Purata pergerakan moden dan maju yang direka untuk kejelasan trend.
Ciri-ciri termasuk:
- Pengekodan warna dinamik untuk pengenalan trend segera
- Pewarnaan bar pilihan untuk membuat keputusan lebih pantas
- Pengiraan licin dan stabil, sesuai untuk semua jangka masa
4. RMS – Penapis Momentum Purata Kuasa Dua Akar
Alat statistik yang mengukur momentum pasaran sebenar dan magnitud harga.
Membantu pedagang menapis bunyi dan mengenal pasti bilakah pasaran mempunyai kekuatan yang cukup untuk mengekalkan pergerakan atau bila ia kehilangan tenaga.
5. Demarker Pivots dengan Papan Pemuka Multi-Jangka Masa
Secara automatik mengesan struktur pivot sebenar dengan ketepatan tinggi.
Termasuk jadual pivot multi-jangka masa, membolehkan pedagang melihat konfluens di pelbagai jangka masa dengan sekilas pandang, memberikan perspektif lengkap mengenai kekuatan trend dan titik reaksi utama.
🔔 Amaran Pintar
Sentiasa berada di hadapan pergerakan pasaran dengan amaran bunyi terbina dalam untuk:
- Pengesahan pecahan
- Isyarat pembalikan
- Reaksi pivot
Amaran memastikan anda tidak pernah terlepas setup berkemungkinan tinggi, walaupun ketika anda jauh dari carta.
🎯 Mengapa Pedagang Memilih Square Matrix
Sistem Perdagangan Square Matrix bukan sekadar penunjuk lain — ia adalah set alat profesional lengkap.
Ini sebabnya pedagang menyukainya:
- Menggabungkan lima alat premium ke dalam satu sistem yang dipermudahkan
- Visual yang sangat bersih dengan rendering stabil zoom — sesuai untuk semua saiz skrin
- Berfungsi lancar pada semua jangka masa dan semua kelas aset
- Dibangunkan dengan logik institusi, tetapi direka untuk kebolehgunaan pedagang runcit
- Boleh disesuaikan sepenuhnya untuk menyesuaikan gaya perdagangan peribadi anda
⚡ Sesuai Untuk
- Pedagang yang mencari kemasukan dan keluar yang tepat
- Pengesanan perubahan trend awal
- Mengesan julatan pasaran, pengukuhan, dan pecahan
- Pedagang yang mahukan satu penyelesaian serba boleh daripada mengendalikan pelbagai alat
- Scalpers, pedagang ayunan, dan pedagang posisi sama-sama
🚀 Berdagang dengan Lebih Bijak menggunakan Square Matrix
Pasaran adalah kompleks, tetapi carta anda tidak perlu begitu.
Sistem Perdagangan Square Matrix oleh LudwigICT memberikan anda semua yang anda perlukan dalam satu pakej — ciri bertaraf institusi, kejelasan visual, dan analitik maju, semuanya dioptimumkan sepenuhnya untuk cTrader Automate.
Tiada lagi tekaan. Tiada lagi kekacauan.
Hanya pandangan perdagangan yang murni dan tersusun.
Dapatkan Sistem Perdagangan Square Matrix hari ini dan bawa perdagangan anda ke tahap seterusnya dengan kejelasan, ketepatan, dan keyakinan.
Jika anda mempunyai sebarang pertanyaan atau menghadapi sebarang masalah, jangan ragu untuk menghubungi saya. Saya gembira untuk membantu anda!
Penafian:
Dengan menggunakan algoritma saya, anda mengakui bahawa perdagangan melibatkan risiko yang melekat dan prestasi lalu tidak menjamin hasil masa depan. Adalah penting bahawa anda mempunyai strategi pengurusan risiko yang kukuh dan, yang paling utama, anda kekal berdisiplin dalam mematuhi tahap stop-loss. Kegagalan mengurus risiko dengan betul boleh menyebabkan kerugian yang ketara. Saya tidak bertanggungjawab atas sebarang hasil kewangan yang timbul daripada penggunaan algoritma ini. Berdagang dengan bertanggungjawab dan sentiasa ikut amalan pengurusan risiko yang betul.
Semoga berjaya! 🙌
.
Ringkasan
Ulasan pelanggan
5 | 100 % | |
4 | 0 % | |
3 | 0 % | |
2 | 0 % | |
1 | 0 % |


