설명
1. 하이퍼 트렌드란 무엇이며 누구를 위한 것인가
하이퍼 트렌드는 cTrader용 추세 추종 오버레이 지표입니다. 단일하고 읽기 쉬운 후행 추세선, 추세에 합류하기 위한 참조 구역, 명확한 신호 표시기, 선택적 차트 내 손절매/이익 실현 프레이밍, 그리고 인터랙티브 패널을 제공하여 설정을 다시 열지 않고도 대부분의 표시 내용을 실시간으로 조정할 수 있습니다.
설계 목표는 의도적으로 단순합니다: 잘 확립된 거래 방법을 사용하여 진정으로 읽기 쉬운 추세와 신호를 출력 — 그리고 전체를 가볍고, 방해되지 않으며, 빠르게 설정할 수 있게 만드는 것입니다.
경험에 관계없이 모든 종류의 트레이더에게 적합합니다.
-
-
- 초보자는 방향과 위험을 명확히 파악할 수 있습니다.
- 경험 많은 트레이더는 자신의 가격 해석을 방해하지 않는 빠르고 구성 가능한 오버레이를 얻습니다.
-
표면적으로는 단순하고 효율적이면서도 그 밑바탕에는 연구된 응용이 있으며, 설정과 미세 조정이 쉽도록 만들어졌습니다.
"무엇을 거래하든, 경험이 어떻든, 하이퍼 트렌드는 읽기 쉽고, 설정이 쉽고, 미세 조정이 쉬워야 합니다."
2. 그 배경 아이디어
이동평균, ATR, 슈퍼 트렌드, 평활 필터 — 이들은 잘 알려진, 확립된
방법들이며, 바로 하이퍼 트렌드가 하는 일과 같습니다: 원시 가격을 읽기 쉬운
추세와 사용 가능한 신호로 변환하는 것입니다.
그렇다면 왜 또 다른 도구가 필요한가요? 실제로 이 분야의 대부분 지표들은 동일한
문제를 공유하기 때문입니다:
-
-
- 재포장. 출판된 많은 것들이 동일하거나 오래된 논리를 이름만 바꾸어
반복 출시하며, 진정으로 새로운 내용은 거의 없습니다. - 차트 혼잡. 많은 지표가 차트에 너무 많은 내용을 쌓아 가격 자체를 읽기 거의 불가능하게
만들고, 내부 논리가 때로는 트레이더의 실제
의도와 반대 방향으로 작동합니다. - 쇠퇴하는 우위. 기본 개념은 좋지만, 오늘날 빠르게 변화하는
시장 — 특히 빠른 타임프레임에서는 — 실제 우위를 유지하지 못하는 경우가 많습니다.
- 재포장. 출판된 많은 것들이 동일하거나 오래된 논리를 이름만 바꾸어
-
하이퍼 트렌드는 이 세 가지 모두에 맞서 싸우는 것을 전제로 합니다. 확립된 기반(평활,
변동성 밴드, 슈퍼 트렌드 스타일 방향)을 유지하면서도 데이터 전처리, 가격 평활, 신호 처리에 대한
새로운 접근법을 적용합니다 — 과학 논문, 거래 저널, 학술 연구에서 논의되는 기법들입니다. 모든 참조 링크는 비디오 설명에서 확인할 수 있습니다.
출처 참고문헌
- ECB: A TREND-CYCLE(-SEASON) FILTER
- Kalman filter demystified: from intuition to probabilistic graphical model to real case in financial markets
- Financial Pricing Models in Continuous Time and Kalman Filtering
- The Holt-Winters filter and the one-sided HP filter: A close correspondence
- A Bayesian Framework for Trend and Seasonality Decomposition
- Hedge Fund Returns, Kalman Filter, and Errors-in-Variables
- Moving Averages for Financial Data Smoothing
- Optimizing the Performance of the Fractal Adaptive Moving Average Strategy: The Case of EUR/USD
- Kalman Filter and Optimal Smoothing Derived by the Regression Model
목적은 간단한 질문을 실제로 테스트하는 것입니다: 이론적 개념들이,
확립된 도구 위에 적용되어, 트레이더에게 실제 우위를 다시 가져다줄 수 있는가? 하이퍼 트렌드는
그 시도의 구체적인 예입니다 — 확립된 방법들을 중요한 부분에서 현대화하고,
가독성을 부차적인 것이 아닌 일급 기능으로 다루었습니다.
"같은 신뢰받는 기반 — 평균, 변동성, 추세 논리 — 이지만
현대적 전처리와 차트를 읽기 쉽게 유지하는 끈질긴 집중이 더해졌습니다."
3. 핵심 포인트 — 차별화 요소
설계상 방해하지 않는 오버레이. 가격 위에 진정으로 유용한 것을 보여주면서도 읽고 있는 가격 흐름을 왜곡하지 않는 균형을 유지합니다.
cTrader에 최적화 — 빠르고 가벼움. 빠른 로딩과 낮은 CPU 사용을 위해 설계되었으며, 여러 인스턴스가 동시에 여러 차트나 심볼에 붙어 있어도 원활하게 작동하도록 만들어져 플랫폼의 반응성을 유지합니다.
깔끔한 파이프라인.
-
-
- 가격 소스 선택. 계산이 실행될 가격을 선택합니다 — 종가, HL2 같은 중간값, HLC3 같은 전형적 가격 등(소스 설정).
- 선택적 전처리. 가격을 헤이킨-아시 캔들
및/또는 칼만 필터를 거쳐 노이즈가 많은 시리즈를 평활화할 수 있습니다 — 이것이 "현대화된 처리" 아이디어의 일부입니다. - 평활화된 추세 기반. 선택한 소스는 나머지 논리가 구축되는 추세 기반을 형성하기 위해 평활화됩니다 — 지배적인 움직임을 추적하도록 설계되었습니다.
- 변동성 밴드. 와일더 평활화된 ATR이 그 기반 위아래에 밴드를 설정합니다.
- 슈퍼트렌드 논리. 표준 슈퍼트렌드 "점착성"이 어느 쪽이 활성 상태인지 결정합니다:
상승 추세에서는 하단 밴드가 후행선이 되고, 하락 추세에서는 상단 밴드가 후행선이 됩니다.
가격이 활성 밴드를 돌파해 마감하면 추세가 전환됩니다.
-
"차트 위에 가볍게 자리 잡도록 만들어졌습니다 — 도움이 되는 것은 보여주고, 그렇지 않은 것은 숨기며, 가격 자체의 흐름을 방해하지 않습니다. 패널에서 한 번 클릭하면 언제든지 깨끗한 가격으로 돌아갑니다."
4. 차트 읽기 — 핵심 시각 요소
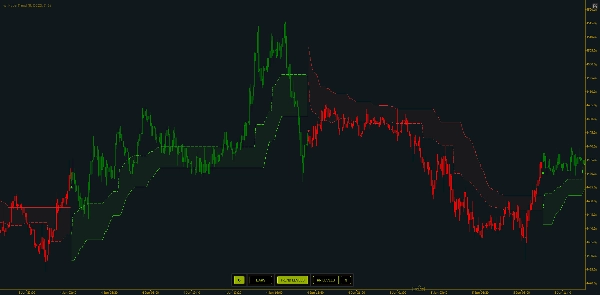
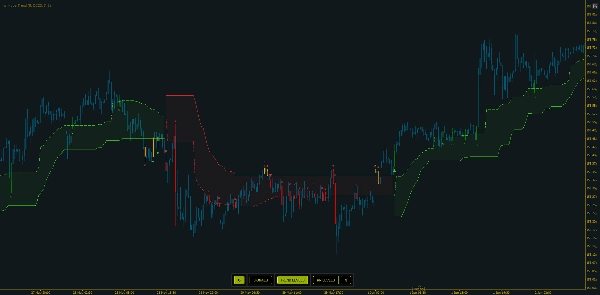
1. 후행선
-
- 녹색 = 상승 추세 (가격 아래 선)
- 빨간색 = 하락 추세 (가격 위 선)
- 색상 변경은 추세 전환입니다
2. 진입 구역
-
- 활성화되면 점선 레벨이 후행선에서 반대 밴드 쪽으로 약간 떨어진 위치에 표시됩니다 — 현재 추세 내에서 극단을 쫓기보다 "가치로의 되돌림" 참조 구역입니다.
Entry Zone Distance가 그 위치 거리를 조절합니다.
3. 바 색상
-
- 바는 활성 방향에 따라 세 가지 스타일로 색칠할 수 있습니다:
-
- 일반 (방향에 따른 강세/약세),
- 모드 1, 전환 단계에서 다른 시각화를 제공합니다
- 모드 2, 중립 전환 바도 추가로 표시합니다.
보이는 녹색/빨간색 후행선이 최종 출력입니다. 나머지 — 진입 구역, 표시기, SL/TP 선, 바 색상 — 모두 동일한 방향 상태 위에 레이어됩니다.
"선의 색상은 한눈에 보는 당신의 체제 편향이며; 점선 구역은 추세가 더 합리적인 진입을 제공하는 곳입니다."
5. 신호 및 알림
하이퍼 트렌드는 세 가지 신호 유형을 구분합니다. 각 신호는 확인된 바에 라벨이 붙은 표시기를 출력하며 독립적으로 토글할 수 있습니다:
-
- 전환 신호 (기본 켜짐) — 추세 전환 방향(또는 편향) 시 트리거됩니다. 이것이 주요 신호입니다.
- 교차 진입 신호 — 기존 추세 내에서 진입 구역의 유효한 왕복 교차 시 트리거됩니다 (가격이 구역을 벗어났다가 다시 되찾음). 되돌림 진입 타이밍용입니다.
- 교차 추세 신호 — 후행선 자체의 유효한 왕복 교차 시 트리거됩니다. 더 풍부한 색상 모드에서는 전환/중립 바에서의 추세선 교차가 새 진입이 아닌 종료 스타일 표시기로 처리됩니다.
- 종료 신호 — 바 색상 - 모드 2가 활성화되었을 때 표시되며, 추세가 힘을 잃고 전환 신호 몇 개 바 전을 알리는 데 도움이 됩니다. 이는 변동성이 낮고 시장 참여가 줄어든 기간을 포착하는 데 유용합니다.
알림: 활성화 시, 하이퍼 트렌드는 선택된 소리를 재생하고 각 감지된 신호에 대해 팝업을 표시합니다. 알림은 동일한 토글을 따르며 — 켠 신호 유형만 알림을 보냅니다 — 차트 내 패널의 알림 버튼으로 실시간 활성화/비활성화할 수 있습니다. 팝업은 간결하며: 심볼과 타임프레임, 신호 유형과 방향, 현재 가격을 표시합니다.
"깨끗한 차트를 위해 전환 신호만으로 시작하고, 더 세밀한 진입 타이밍이 필요할 때 교차 신호를 추가하세요. 각각은 소리와 팝업으로 알림을 보낼 수 있습니다."
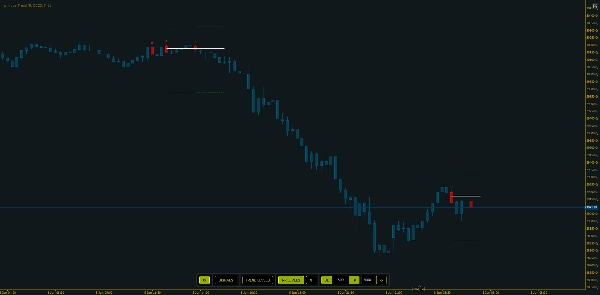
6. 거래 계획 — 차트상의 위험/보상 레벨
손절매/목표 레벨이 켜져 있으면, 각 신호 바에 세 개의 짧은 수평선이 표시됩니다: 신호 바의 중간 가격에 위치한 진입 선, 손실 쪽에 고정된 핍 거리의 SL 선, 이익 쪽에 고정된 핍 거리의 TP 선입니다.
레벨은 고정된 바 수만큼 미리 연장되며 이후에는 더 이상 늘어나지 않습니다 — 신호 시점의 스냅샷입니다. 새로운 신호가 이전 세트를 잘라내어 레벨이 겹치지 않도록 합니다. 진입, SL, TP 각각은 고유한 색상과 조절 가능한 선 너비 및 스타일을 가집니다.
"거래를 시각적으로 프레이밍합니다 — 진입, 손절, 목표 — 그래서 거래 전에 위험 대비 보상을 보고, 차트를 깔끔하게 유지하기 위해 오래 남는 세트 수를 제한합니다."
7. 인터랙티브 패널 — 시각 요소를 실시간으로 변경
차트 내 패널은 매개변수를 다시 열지 않고도 표시되는 내용을 즉시 변경합니다.
활성 토글은 강조 표시되며; 패널은 항상 현재 상태를 반영합니다. 차트 내 위치를 여러 옵션으로 설정하거나 완전히 숨길 수 있습니다.
"보통 설정에서 파고드는 모든 것 — 색상, 추세 레벨, 위험 선, SL/TP 거리 — 이 패널에서 한 번의 클릭으로 가능합니다. 새 거리를 입력하고 새로 고침을 누르면 레벨이 업데이트됩니다."
8. 거래 접근법 — 몇 가지 예
접근법 A — 전환 거래 (추세 추종). 전환 신호를 주요 신호로 사용하세요: 확인된 전환 시 새 방향으로 진입하고 후행선을 시각적 무효화로 사용합니다. 반대 색상으로 다시 전환되면 종료/반전입니다. 가장 간단하고 깔끔한 읽기입니다.
접근법 B — 추세 내 되돌림 진입. 이미 추세가 확립된 상태에서 가격이 진입 구역으로 되돌림할 때까지 기다리고, 교차 진입 신호를 켜서 가격이 구역을 다시 차지하는 순간을 표시하게 하세요 — 극단을 쫓기보다 더 나은 가치로 추세에 합류합니다.
접근법 C — 모든 설정에 위험 프레이밍. RR 레벨을 켜고, 심볼의 변동성에 맞는 SL/TP 거리를 설정하세요. 진입/손절/목표를 거래 전에 보고 거래를 관리할 수 있습니다.
세 가지 모두에 공통적인 핵심은 판단력입니다: 추세 방향으로 행동하고, 주변 가격 행동으로 확인하며, 선을 참조로 사용하세요 — 하이퍼 트렌드는 읽기 도구이고, 거래는 당신이 배치하고 관리합니다.
"전환을 거래하거나, 구역으로의 되돌림을 기다리거나, 위험 선으로 모든 설정을 프레이밍하세요 — 자신에게 맞는 접근법을 선택하세요. 시장 상황을 이해하고 RSI나 MACD 같은 다른 도구와 결합해 다이버전스를 포착하세요. 그 조합이 가치를 발휘합니다."
9. 평가 방법
실용적 점검: 과거를 스크롤하며 추세선이 지속된 움직임의 올바른 쪽에 있었는지, 전환이 어디에 집중되었는지 확인; 두 설정을 나란히 비교 (예: 다른 ATR 배수나 추세 조회 기간)하여 반응성 대 평활성의 균형을 평가; 과거 SL/TP 프레임을 검토하여 선택한 거리에서 목표가 손절 전에 얼마나 자주 도달했는지 평가; 시장에 맞게 조정 (명확한 추세 대 좁은 범위); 그리고 시간을 고려 — 실제 시장 움직임 중에 최적의 체제를 식별하므로, 활성 시간과 조용한 비활성 시간을 비교하세요.
"과거를 스크롤하며 설정을 비교해 평가하세요 — 전환이 얼마나 깔끔한지, 진입 구역이 되돌림 타이밍을 얼마나 잘 맞추는지, SL/TP 프레임이 어떻게 해소되는지."
10. 한계 및 기타 참고사항
하이퍼 트렌드는 일반적이고 재포장된 지표보다 높은 품질을 목표로 하지만, 도구일 뿐, 수정 구슬은 아닙니다:
-
- 여전히 거짓 신호를 낼 수 있습니다. 모든 신호에 기계적으로 반응하면 긍정적 결과를 스스로 만들어내지 못합니다.
- 기술과 맥락을 보상합니다. 가격을 읽는 기본 능력과 주변 시장 감각이 필요합니다. 그 맥락과 건전한 자금 관리와 결합하면 진정으로 강력한 도구가 되며, 이 조합이 장기적으로 긍정적 결과를 낳습니다.
- 시장이 움직일 때 가장 좋습니다. 조용한 기간이나 정규 거래 시간 외에는 품질이 떨어집니다.
- 추세 도구는 지연과 휘둘림이 있습니다. 슈퍼트렌드 스타일 접근법처럼, 전환은 반전 시 늦게 오거나 범위 내에서 집중될 수 있으며; 평활과 ATR 밴드가 이를 줄이지만 제거하지는 않습니다.
- SL/TP 선은 계획 보조 도구이며 보장은 아닙니다. 신호 바 중간 가격에서 고정 핍 참조이며, 스프레드, 슬리피지, 실제 체결을 고려하지 않고 추적하지도 않습니다.
"기본 가격 읽기, 시장 맥락, 자금 관리를 결합하면 장기적으로 진정으로 강력해집니다 — 시장이 움직일 때 가장 강력합니다."
하이퍼 트렌드는 깔끔하고 방해하지 않는 오버레이로 제공되며, 내장된 진입 타이밍, 명확한 신호, 차트 내 위험 프레이밍, 실시간 제어 패널을 갖추고 있습니다. 사용하기 쉽고, cTrader에 가볍고, 모든 트레이더가 어떤 심볼이나 타임프레임에서도 사용할 수 있도록 설계되었습니다.
"설정이 쉽고, 실행이 가볍고, 모든 트레이더가 추세를 읽고 진입과 종료를 표시하며 위험을 프레이밍하도록 돕기 위해 만들어졌습니다 — 깔끔하고 읽기 쉽게 유지됩니다."
요약
Under the hood, HyperTrend processes price data through selectable sources and optional smoothing filters such as Heikin-Ashi and Kalman filters. It applies volatility bands based on ATR and SuperTrend logic to determine active trend direction. The indicator offers three types of signals—trend switches, entry zone crosses, and trailing line crosses—with labeled markers and optional alerts via sound and popups.
Risk management is supported through on-chart stop-loss and take-profit levels displayed as horizontal lines at fixed pip distances from entry points, helping traders visualize risk/reward before committing. An interactive on-chart panel allows live adjustment of visual settings and parameters without reopening menus.
HyperTrend is optimized for fast, low-CPU performance on cTrader, suitable for all trader experience levels, and applicable across symbols and timeframes. It emphasizes readability and simplicity while incorporating modern data processing techniques to enhance traditional trend-following methods.