
설명
포함된 내용:
- 개요 - 지표가 하는 일
- 풋프린트 개념 - 풋프린트 트레이딩이란 무엇인가
- 상세 계산 방법 - 거래량이 계산되는 방법:
-
- 가격 수준 생성
- 거래량 분포 알고리즘
- 매수/매도 분할 논리
- 예제 계산
- 거래량 표시 설명 - "45x120"의 의미
- 델타 해석 - 양수, 음수 및 누적
- 주요 특징 - 불균형, POC, 거래량 바
- 오더 플로우 이론 - 매수와 매도 설명
- 중요한 제한 사항 - 실제 틱 데이터가 아닌 추정치임을 솔직하게 설명
- 트레이딩 응용 - 5가지 실제 트레이딩 시나리오
- 설정 가이드 - 모든 매개변수에 대한 완전한 설명
- 타임프레임 권장 사항 - 다양한 스타일에 맞는 최적 설정
- 팁 및 모범 사례
계산에 관한 주요 사항:
문서에서는 명확하게 설명합니다:
거래량은 추정치입니다 - cTrader가 실제 틱 데이터를 제공하지 않기 때문입니다 알고리즘은 지능적입니다 - 여러 요소(캔들 유형, 가격 위치, 종가 근접성)를 사용합니다 패턴은 정확합니다 - 상대적 관계가 실제 오더 플로우를 반영합니다 제한 사항에 대해 솔직합니다 - 실제 거래소 데이터가 필요한 시점을 설명합니다 정확한 공식도 보여줍니다 - 계산에 대한 완전한 투명성
이로써 사용자는 현실적인 기대를 가지면서 지표의 가치를 이해할 수 있습니다! 📊
요약
AI 요약
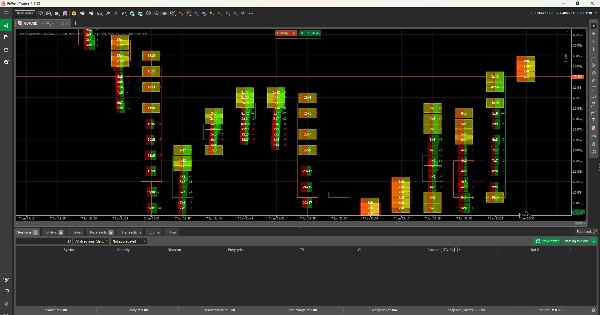
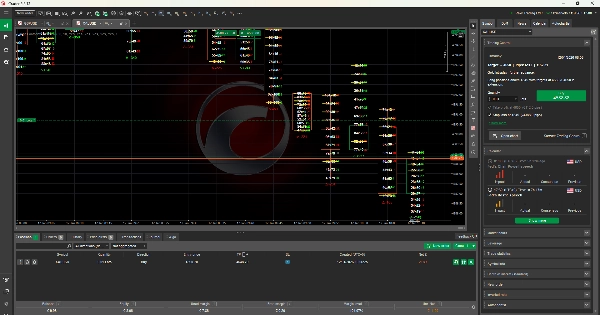
Delta Footprint Bid x Ask is a footprint volume indicator designed to display bid and ask volume splits at each price level. It estimates volume distribution using an intelligent algorithm that incorporates factors such as candle type, price position, and close proximity, as real tick data is not available on the cTrader platform. The indicator provides detailed volume calculations, including price level creation, buy/sell split logic, and example computations, offering transparency through exact formulas. Key features include identification of volume imbalances, point of control (POC), and volume bars, supporting analysis of order flow by comparing bid versus ask volumes. The indicator explains delta values—positive, negative, and cumulative—and offers guidance on settings and timeframe recommendations for various trading styles. It is applicable across multiple markets and symbols, including Forex pairs (EURUSD, GBPUSD, USDJPY, NZDUSD), indices (NAS100, SP500, DAX), commodities (gold, oil, silver), cryptocurrencies (BTCUSD), and stocks. The tool includes practical trading applications and best practices, helping users interpret footprint patterns that realistically mirror order flow despite volume estimates.
지표 프로필
고객 리뷰
4.5
리뷰: 2
5 | 50 % | |
4 | 50 % | |
3 | 0 % | |
2 | 0 % | |
1 | 0 % |
고객 리뷰
January 20, 2026
For volume based context, this feels more useful as a filter than a full system. The journal should cover 55 setups and the trade context.
January 12, 2026
For me the fair test is value area with POC and VWAP. If the result still looks clean, the product becomes easier to trust.
상담
자주 묻는 질문(FAQ)
BTCUSD
Forex
Signal
Indices
EURUSD
Commodities
GBPUSD
NZDUSD
Prop
Scalping
Supertrend
Fair Value Gap
Crypto
Stocks
XAUUSD
NAS100
USDJPY
트레이딩 봇, 지표, 플러그인 등 cTrader Store에서 제공되는 상품은 제3자 개발자에 의해 제공되며, 이는 단순히 정보 및 기술적 접근을 목적으로 제공된 것입니다. cTrader Store는 중개인이 아니며, 투자 조언, 개인별 추천 또는 향후 성과에 대한 어떠한 보장도 제공하지 않습니다.
이 작성자의 상품 더 보기


좋아하실 만한 다른 항목


가격
가입일 15/01/2025
7
판매