
설명
AI로 시장을 더 똑똑하게 읽으세요.
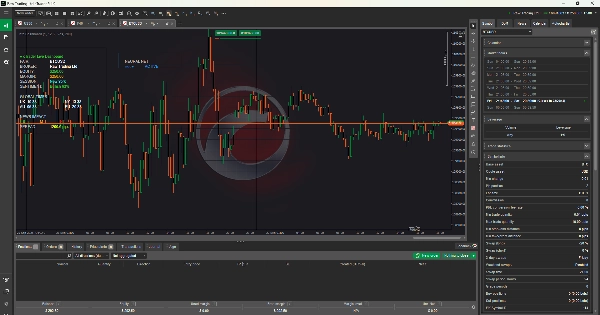
The Info Dashboard는 신경망, 감성 분석, 실시간 시장 데이터를 하나의 강력한 도구로 결합한 올인원 거래 동반자입니다.
✅ AI Neural Net Insights – 패턴을 즉시 감지하고 시장 움직임을 예측합니다.
✅ News & Sentiment Impact – 시장을 흔드는 이벤트를 앞서 파악하세요.
✅ Equity & Balance Tracking – 실시간으로 계좌 상태를 모니터링합니다.
✅ Global Market Clocks – 세션 시작과 종료를 절대 놓치지 마세요.
✅ Pair Strength & Spread Monitor – 가장 강력한 기회를 식별하세요.
외환, 암호화폐, 지수를 위해 설계된 forex, crypto, and indices 대시보드는 복잡한 데이터를 실행 가능한 신호로 바꾸어 명확성과 속도를 제공합니다. 초보자와 전문가 모두에게 시장에서 우위를 점할 수 있는 완벽한 도구입니다.
Info Dashboard와 함께라면 단순히 차트를 따라가는 것이 아니라—차트를 이해하게 됩니다.
오늘 거래를 업그레이드하고 시장 분석의 미래를 경험하세요.
요약
지표 프로필
고객 리뷰
4.5
리뷰: 2
5 | 50 % | |
4 | 50 % | |
3 | 0 % | |
2 | 0 % | |
1 | 0 % |
고객 리뷰
October 8, 2025
Tbh it is not magic, just a decent extra filter. It needs a few bad trades in the sample too.
October 7, 2025
The good surprise is bad setups become easier to pass on. Risk still needs respect.
상담
자주 묻는 질문(FAQ)
Signal
Indices
Commodities
GBPUSD
RSI
Bollinger
Fibonacci
Scalping
AI
XAUUSD
NAS100
MACD
BTCUSD
Forex
Breakout
EURUSD
NZDUSD
Martingale
Prop
ZigZag
Supertrend
Fair Value Gap
SMC
Crypto
Grid
Stocks
ATR
USDJPY
VWAP
트레이딩 봇, 지표, 플러그인 등 cTrader Store에서 제공되는 상품은 제3자 개발자에 의해 제공되며, 이는 단순히 정보 및 기술적 접근을 목적으로 제공된 것입니다. cTrader Store는 중개인이 아니며, 투자 조언, 개인별 추천 또는 향후 성과에 대한 어떠한 보장도 제공하지 않습니다.
이 작성자의 상품 더 보기


좋아하실 만한 다른 항목


가격
가입일 15/01/2025
7
판매