
설명
세션 볼륨 프로필 HD
기능
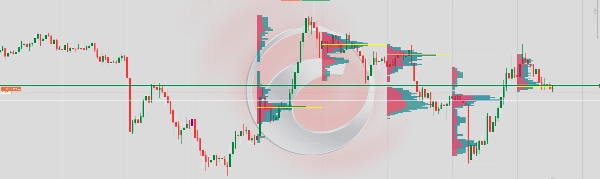
각 거래 세션에 대한 수평 볼륨 프로필을 차트에 직접 표시합니다. 거래량이 가격 수준별로 어떻게 분포되어 있는지 보여주어, 거래자들이 고활동 구역, 공정 가치 영역 및 순수하게 거래량 행동에서 파생된 주요 지지/저항 수준을 식별하는 데 도움을 줍니다.
작동 방식
새로운 바가 마감될 때마다, 지표는 정의된 세션 수 내의 모든 바를 스캔하고 각 바의 틱 거래량을 가격 범위에 분배합니다. 거래량은 매수 측(강세 바)와 매도 측(약세 바)로 바의 시가/종가 방향을 대리로 사용하여 나뉩니다. 결과는 세션의 시간 경계에 고정된 계층형 수평 히스토그램으로 렌더링됩니다.
시각적 요소
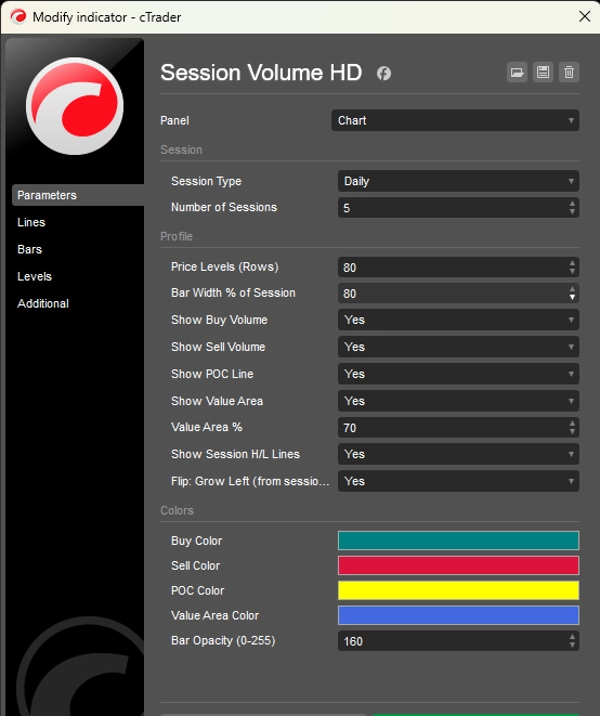
매수 바 (청록색) — 각 수준에서 강세 가격 움직임에 거래된 거래량을 표시합니다. 세션 앵커에서 왼쪽(또는 반전된 경우 오른쪽)으로 확장됩니다.
매도 바 (빨간색) — 각 수준에서 약세 가격 움직임에 거래된 거래량을 표시하며, 매수 바 옆에 쌓입니다.
POC 라인 (노란색) — 제어 지점. 세션 내에서 총 거래량이 가장 높은 가격 수준을 표시하는 수평선입니다. 가격에 대한 자석 역할을 합니다.
가치 영역 (파란색 오버레이) — 세션 총 거래량의 구성 가능한 백분율(기본값 70%)을 포함하는 가격 범위입니다. 대부분의 거래가 이루어진 "공정 가치" 구역을 나타냅니다.
세션 최고/최저선 (흰색 점선) — 세션 동안 도달한 최고 및 최저 가격을 표시합니다.
성능
이 지표는 새로운 바가 생성될 때만 한 번 다시 그리며, 모든 틱마다 다시 그리지 않습니다. 이는 깜박임을 제거하고 많은 세션과 높은 가격 수준 수에서도 안정적인 렌더링을 보장합니다.
제한 사항
cTrader가 틱 데이터 피드 없이 바 수준에서 실제 매수/매도 거래량을 노출하지 않기 때문에, 매수/매도 거래량은 근사치로 바 방향을 사용하여 계산됩니다: 강세 바는 65% 매수 / 35% 매도, 약세 바는 반대이며, 도지 바는 50/50으로 분할됩니다. 실제 델타 거래량을 위해서는 틱 데이터 구독이 필요합니다.


