


설명
📊 머니 플로우 프로필
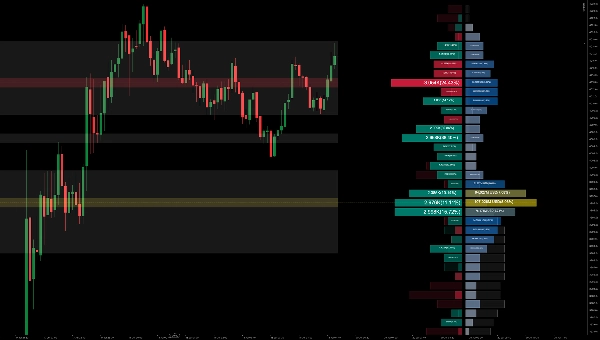
머니 플로우 프로필은 지정된 기간 동안 시장의 모든 가격대에서 거래량 또는 머니 플로우 를 측정하는 고급 차트 도구입니다. 이는 자산 가격과 거래자들의 매수 또는 매도 의지 간의 관계를 강조하여 다음을 가능하게 합니다:
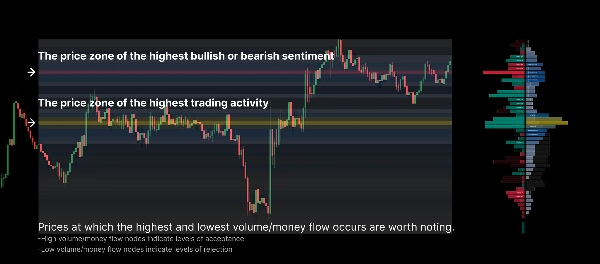
- 주요 가격대 공개: 컨트롤 포인트(POC)와 같은 거래량 클러스터 및 고유동성 노드를 쉽게 식별합니다.
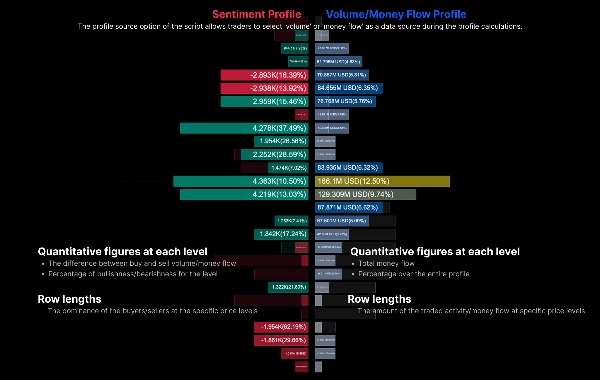
- 시장 심리 분석: 왼쪽에 심리 프로필, 오른쪽에 거래량 프로필을 표시하여 각 특정 가격대에서 매수자 또는 매도자가 우세한지 판단합니다.
- 기간 간 비교: 현재 프로필을 이전 기간의 고스트 프로필과 직접 비교하여 시장의 중력 중심 이동을 관찰합니다.
⚙️ 핵심 매개변수 및 사용 가이드
1. 일반 설정
- 조회 길이 / 고정 범위: 프로필 계산에 사용되는 과거 바의 수를 정의합니다(예: 최근 200개 바).
- 데이터 소스:
-
1 = 거래량: 전통적인 틱/거래량을 기반으로 프로필을 계산합니다.2 = 머니 플로우: 가격 깊이를 포함하여 머니 플로우 분포를 계산합니다.
2. 프로필 설정
- 행 해상도 (행 수): 세로 축의 세분성을 결정합니다. 숫자가 높을수록(예: 50-100) 더 상세한 프로필이 생성됩니다.
- 프로필 너비 및 수평 오프셋: 프로필이 그려지는 너비(백분율)와 현재 캔들스틱과 겹치지 않도록 오른쪽으로 얼마나 이동할지 조정합니다.
3. 심리 및 표시
- 심리 극성:
-
1 = 캔들: 캔들의 시가와 종가(극성)를 기반으로 강세/약세 심리를 결정합니다.2 = 매수/매도 압력: 심지와 고가/저가 대비 종가를 고려한 보다 정밀한 계산을 사용합니다.
- 심리 프로필 / 거래량 프로필 표시: 순 심리 프로필(왼쪽)과 주요 거래량 프로필(오른쪽)을 독립적으로 토글하여 표시합니다.
- 이전 기간 표시: 활성화하면 이전 기간과 동일한 시간 창을 나타내는 배경 "고스트 바" 프로필을 그립니다. 지지/저항 변화 추적에 유용합니다.
4. 확장 영역 표시
- 히트맵 표시: 전체 계산 기간 동안 프로필 밀도를 배경 히트맵으로 투영합니다. "거래량" 또는 "심리" 중 선택할 수 있습니다.
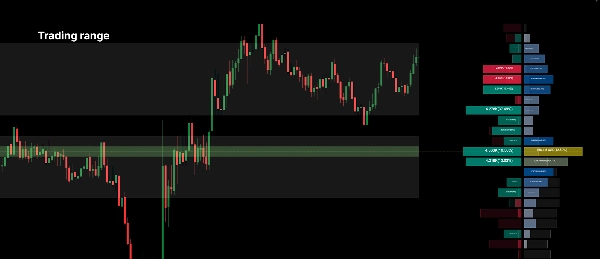
- 가치 영역 표시: 대부분의 거래량이 발생한 핵심 가격 범위를 강조합니다. 임계값은 사용자 지정 가능(예: 70%)합니다.
- POC 영역 표시: 선택한 범위에서 가장 높은 거래량을 가진 가격대인 컨트롤 포인트에 수평선과 영역을 자동으로 그립니다.
💡 실전 거래 팁:
- 강력한 지지 또는 저항 수준으로 작용하는 고거래량 노드(피크) 를 찾아보세요.
- 가격이 빠르게 움직이는 경향이 있는 저거래량 노드(계곡) 를 찾아보세요.
- 이전 기간 고스트 프로필을 활용하세요 : 현재 POC(노란선)가 이전 기간 POC보다 높게 형성되면 가치 합의가 상승하고 있음을 나타내며, 이는 일반적으로 강세 신호입니다.
요약
AI summary
Money Flow Profile is an advanced indicator that maps traded volume and market sentiment across price levels over a specified time period. It visualizes the relationship between price and trader activity, highlighting key liquidity zones such as volume clusters and the Point of Control (POC). The tool displays a Sentiment Profile on the left and a Volume Profile on the right, enabling users to assess whether buyers or sellers dominate at each price level. It supports direct comparison with the previous period’s profile via a ghost overlay to track shifts in market value consensus.
Core configurable parameters include lookback length, data source selection (volume or money flow), row resolution for vertical granularity, profile width and offset, and sentiment polarity calculation methods (candle-based or buy/sell pressure). Display options allow toggling of sentiment and volume profiles, previous period overlays, heatmaps of volume or sentiment density, value area highlighting, and automatic POC zone marking.
The indicator is designed to help identify strong support and resistance levels at high volume nodes and anticipate rapid price movements through low volume nodes. It supports detailed volume and sentiment analysis to inform trading decisions based on liquidity and market structure.
Core configurable parameters include lookback length, data source selection (volume or money flow), row resolution for vertical granularity, profile width and offset, and sentiment polarity calculation methods (candle-based or buy/sell pressure). Display options allow toggling of sentiment and volume profiles, previous period overlays, heatmaps of volume or sentiment density, value area highlighting, and automatic POC zone marking.
The indicator is designed to help identify strong support and resistance levels at high volume nodes and anticipate rapid price movements through low volume nodes. It supports detailed volume and sentiment analysis to inform trading decisions based on liquidity and market structure.
지표 프로필
지표 카테고리
거래량
출력 유형
시각화
데이터 요구 사항
거래량
DoM
막대만
틱 데이터
지원되는 신호
돌파
추세 강도
반전
변동성
레벨 터치
레벨 돌파
고객 리뷰
0.0
리뷰: 0
고객 리뷰
이 상품에 대한 리뷰가 아직 없습니다. 이미 사용해 보셨나요? 다른 사람들에게 가장 먼저 소개해 주세요!
상담
자주 묻는 질문(FAQ)
Key Levels
Volume
트레이딩 봇, 지표, 플러그인 등 cTrader Store에서 제공되는 상품은 제3자 개발자에 의해 제공되며, 이는 단순히 정보 및 기술적 접근을 목적으로 제공된 것입니다. cTrader Store는 중개인이 아니며, 투자 조언, 개인별 추천 또는 향후 성과에 대한 어떠한 보장도 제공하지 않습니다.
이 작성자의 상품 더 보기






















가격
534.4M
거래량
9.76M
핍 수익
4
판매