
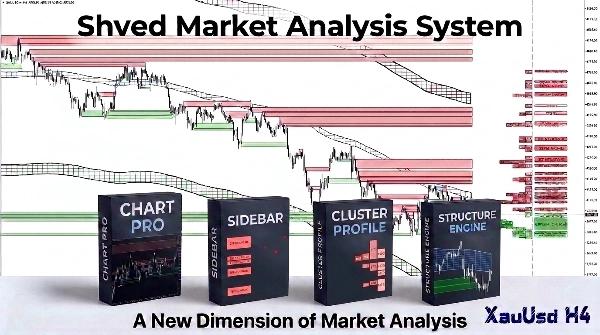
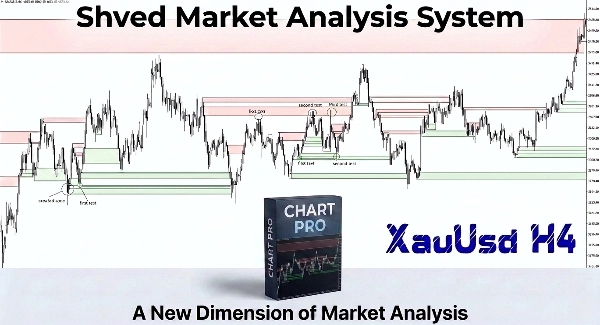

설명
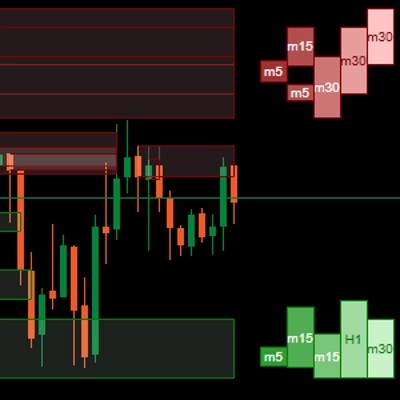
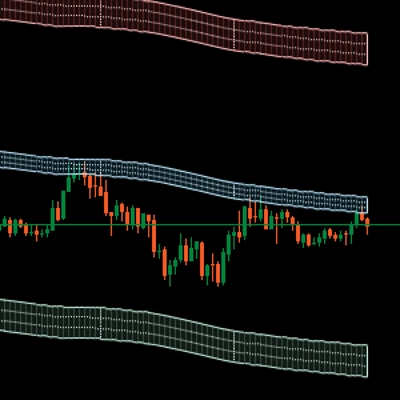
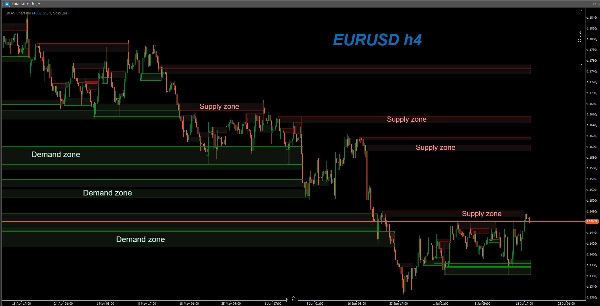
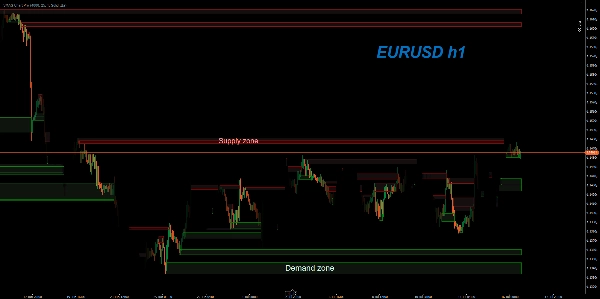
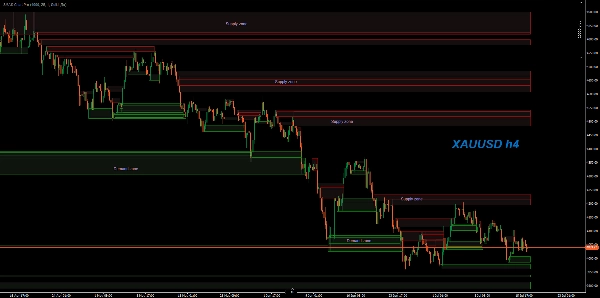
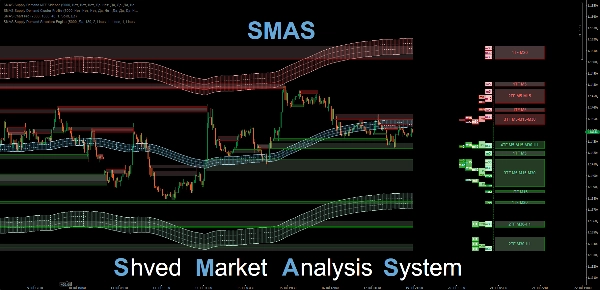
SMAS 차트 Pro 지표는 Shved Market Analysis System(SMAS)의 필수 구성 요소입니다. 이는 cTrader 플랫폼을 위한 전문 분석 도구로, 가격 차트에서 강력한 공급 및 수요 영역을 자동으로 감지하고 동적으로 추적하도록 설계되었습니다.
이 지표는 전 세계 수천 명의 트레이더가 신뢰하는 독점 Shved 공급 및 수요 알고리즘을 기반으로 구축되었습니다. cTrader용 Pro 버전은 cTrader Automate 아키텍처에 대한 깊은 성능 최적화와 함께 C#으로 작성된 완전히 재설계된 첨단 영역 감지 알고리즘을 특징으로 합니다.
이 지표는 매우 다재다능합니다: 고급 코드 최적화 덕분에 단기 스캘핑(M1 및 M5 타임프레임)과 장기 포지션 트레이딩 또는 투자(H4, 일간 및 그 이상의 간격) 모두에 완벽하게 적합합니다.
cTrader 버전의 주요 장점:
- 보호된 독점 알고리즘: 모든 기본 감지 비율은 어떤 자산에서도 자동으로 작동합니다. 지적 재산권 보호를 위해 매개변수는 코드 내에 숨겨져 있습니다.
- 영역 불투명도 조정: 사용자 지정 매개변수를 통해 영역 채우기의 투명도를 조절할 수 있습니다(권장 값은 25에서 40 사이). 이를 통해 밝은 테마와 어두운 테마 모두에서 캔들스틱과 그리드 라인이 완벽하게 선명하게 유지됩니다.
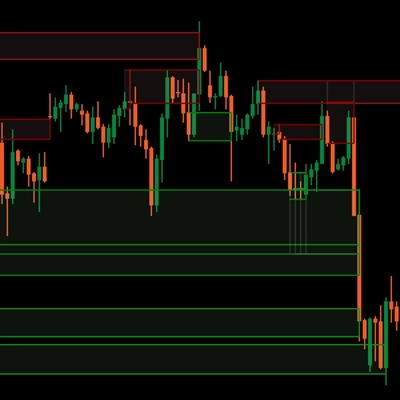
- 동적 완화 추적: 가격이 극한 경계를 돌파할 때까지 영역은 활성 상태를 유지하며 오른쪽으로 확장됩니다("Break Both Levels" 규칙). 가격이 제한 장벽을 완전히 흡수하면 레벨이 비활성화됩니다.
- 역사적 테스트 및 반응 보기: 깨진 영역 표시(Show Invalid Zones)를 활성화할 수 있습니다. 이들은 차트에 얇은 선으로 남아 기본 색상으로 변경되어 과거 반등을 시각적으로 분석할 수 있게 합니다.
- 높은 성능: 코드는 깨끗한 C#(.NET)으로 작성되었으며 타이머 기반 디바운싱을 통해 M1 타임프레임에서도 즉각적인 차트 로딩과 지연 없는 성능을 보장합니다.
거래 권장 사항:
공급 및 수요 영역은 최소한의 위험으로 레벨 재테스트 시 진입점을 찾기에 이상적인 영역입니다. 손절매는 일반적으로 기본의 반대쪽 외부 경계 바로 너머에 배치되어, 거래에 대해 타이트한 손절과 높은 위험/보상 비율을 보장합니다.
==================================================
РУССКИЙ ПЕРЕВОД / RUSSIAN VERSION
==================================================
Индикатор SMAS Chart Pro является важной частью торговой системы Shved Market Analysis System (SMAS). Это профессиональный аналитический инструмент для платформы cTrader, предназначенный для автоматического поиска и динамического ведения сильных зон спроса и предложения (Supply & Demand) непосредственно на вашем ценовом графике.
Этот индикатор создан на базе оригинального алгоритма Shved Supply and Demand, который завоевал доверие тысяч трейдеров. Версия Pro для cTrader получила полностью переработанный, высокотехнологичный алгоритм поиска зон, написанный на C# с глубокой оптимизацией производительности под архитектуру cTrader Automate.
Индикатор универсален: благодаря оптимизации кода он подходит как для внутридневного скальпинга (на таймфреймах M1 и M5), так и для долгосрочного позиционного трейдинга и инвестирования (на H4, Daily и старших интервалах).
Оригинальный алгоритм фильтрации шума:
Главное отличие индикатора от большинства стандартных программ заключается в его математическом ядре сканирования. Стандартные индикаторы часто отмечают любые случайные развороты цены или фракталы. SMAS Chart Pro использует фильтр рыночного шума: он оценивает скорость и импульс резкого выхода цены относительно размера и волатильности самого диапазона накопления ордеров.
Алгоритм математически вычисляет, был ли ценовой разворот результатом институциональной проторговки с нереализованным лимитным объемом или это обычный хаотичный шум. Это позволяет отсеивать слабые уровни, оставляя на графике только те зоны, от которых цена с высокой вероятностью получит сильную реакцию.
Модели поиска Price Action:
Алгоритм сканирует график на предмет формирования четырех классических моделей Price Action:
- Rally-Base-Rally (RBR) и Drop-Base-Rally (DBR) — для зон спроса (покупок / Demand).
- Drop-Base-Drop (DBD) и Rally-Base-Drop (RBD) — для зон предложения (продаж / Supply).
Каждый паттерн строго оценивается по пропорциям силы первоначального импульса, размера и длительности ценовой консолидации, а также скорости последующего выхода цены из этого диапазона.
Ключевые преимущества версии для cTrader:
- Защищенный авторский алгоритм: Все пропорции поиска баз настроены профессионально и работают автоматически на любых инструментах. Параметры скрыты внутри кода для защиты интеллектуальной собственности.
- Регулировка прозрачности (Zone Opacity): Специальный параметр позволяет настроить прозрачность заливки зон (рекомендуемое значение — от 25 до 40). Это позволяет сохранить полную четкость свечей и сетки графика на любой теме терминала (светлой или темной).
- Динамическое ведение зон (Mitigation): Зона остается полностью активной и продлевается вправо, пока цена не пробьет её экстремум (правило Break Both Levels). Как только цена полностью поглощает лимитный барьер, уровень деактивируется.
- История тестов и реакций: Вы можете включить отображение пробитых зон (Show Invalid Zones). Они останутся на графике в виде тонких линий, изменив цвет на цвет базы, что позволит наглядно оценивать историю отскоков.
- Высокая производительность: Код написан на чистом C# (.NET) и оптимизирован для стабильной работы даже при анализе глубокой истории баров.
요약
Key features include automatic zone detection with protected algorithm parameters, adjustable zone opacity for clear visualization on different chart themes, and dynamic mitigation tracking where zones remain active until price breaks their boundaries. It also offers a historical view of broken zones to analyze past price reactions. The algorithm filters market noise by evaluating price impulse strength, consolidation size, and volatility to highlight only significant zones likely to influence price action.
The indicator scans for four classic Price Action patterns—Rally-Base-Rally, Drop-Base-Rally, Drop-Base-Drop, and Rally-Base-Drop—to identify demand and supply zones. These zones serve as potential entry points with defined stop loss placement beyond opposite boundaries, aiming for favorable risk/reward ratios. SMAS Supply Demand Chart Pro is designed for use on any asset and integrates smoothly within the cTrader Automate environment.