Beschreibung
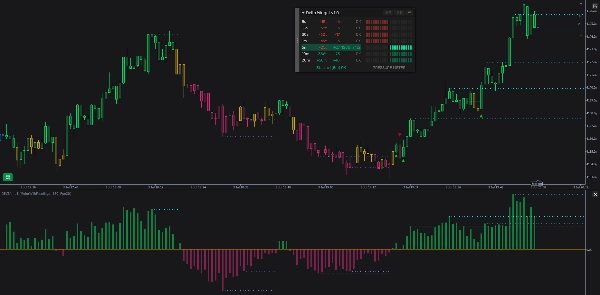
Der Indikator überwacht den Live-Tick-Stream und hält für jeden von Ihnen aktivierten Zeitrahmen (von 5 Sekunden bis zu 20 Minuten) ein rollierendes Fenster der jüngsten Aktivität. In jedem Fenster vergleicht er zwei Dinge: in welche Richtung sich der Preis bewegt hat und in welche Richtung der Orderflow geneigt war (eine Schätzung des Kauf-/Verkaufsdrucks, die aus der Tick-Bewegung rekonstruiert wird, da cTrader kein echtes Volumen veröffentlicht). Wenn Preis und Flow in dieselbe Richtung zeigen, liest der Zeitrahmen OK. Wenn sie nicht übereinstimmen, wird eine Divergenz angezeigt — BULL, wenn der Preis fällt, aber der Flow kauft, BEAR, wenn der Preis steigt, aber der Flow verkauft — und misst, wie lange diese Uneinigkeit anhält. All dies wird über ein verschiebbares On-Chart-Panel dargestellt (eine Anzeige pro Zeitrahmen plus eine kombinierte Urteilslinie und ein optionales Kauf-/Verkaufs-Druckmessgerät), optionale Kerzenfärbung, die Kerzen nach der vorherrschenden Richtung einfärbt, ein Histogramm im Unterfenster, Marker, wenn sich die vorherrschende Richtung ändert, optionale Referenzlinien, die Divergenzen zwischen Preis und Histogramm leicht erkennbar machen, und optionale Soundalarme, die Ihnen akustische Hinweise geben, ohne dass Sie den Bildschirm beobachten müssen.
Die Flow-Schätzung (Grundlage)
cTrader gibt kein echtes Kauf-/Verkaufsvolumen preis, daher schätzt der Indikator den Flow anhand der Preisbewegung selbst: Jede Aufwärtsbewegung zählt als Kauf, jede Abwärtsbewegung als Verkauf, und ein Tick ohne Preisänderung behält entweder die vorherige Neigung bei oder wird als neutral gezählt (Ihre Wahl — siehe Flat Tick Carry). Um nicht durch das Flackern des Bid/Ask-Spreads getäuscht zu werden, wird der Preis als Mid-Price (der Mittelpunkt zwischen Bid und Ask) gelesen.
Jeder Tick wird einmal verarbeitet und in einem gemeinsamen Pool gespeichert, aus dem alle Zeitrahmen lesen, sodass nichts dupliziert wird und der Speicher auch bei Aktivierung aller Zeitrahmen klein bleibt. Jeder Zeitrahmen betrachtet einfach den Ausschnitt dieses Pools innerhalb seines eigenen Fensters.
Für jedes Fenster verfolgt der Indikator:
- Preisbewegung — wie weit der Preis im Fenster gereist ist, angegeben in Ticks (die kleinste Preiseinheit des Instruments).
- Flow (Delta) — die Netto-Kauf-minus-Verkauf-Neigung über dasselbe Fenster.
Die Zeitrahmen
Es gibt eine Zeile pro aktiviertem Zeitrahmen, immer sortiert vom kürzesten zum längsten: 5s, 15s, 30s, 1m, 5m, 10m, 20m. Diese Reihenfolge ist auch die Reihenfolge der Panel-Zeilen und bestimmt, wie viel Gewicht jeder Zeitrahmen bei der Kerzenfärbung hat — langsamere Zeitrahmen zählen mehr.
Beim Laden wärmt der Indikator jeden Zeitrahmen auf, indem er die jüngste Historie genau auf dem gleichen Pfad abspielt, den Live-Ticks nehmen, sodass jede Zeile sofort sinnvoll ist, anstatt leer zu starten und sich erst mit der Zeit zu füllen (siehe Preload History und Max History Bars).
Das Panel
Ein verschiebbares Panel sitzt auf Ihrem Chart. Es hat eine Titelleiste mit drei Schaltflächen, einen Bereich, der eine Lesetabelle, ein Druckmessgerät oder beides anzeigen kann, und eine kombinierte Urteilslinie.
Lesetabelle
Eine Zeile pro Zeitrahmen mit vier Spalten:
- TF — das Zeitrahmen-Label (5s, 15s, …20m).
- Preis — die Preisbewegung im Fenster in Ticks, mit Vorzeichen (zum Beispiel
+350toder-650t). Grün bei Steigerung, Rot bei Rückgang. - Delta — die Flow-Neigung als vorzeichenbehaftete Zahl (zum Beispiel
+16oder-12). Grün, wenn Kauf dominiert, Rot, wenn Verkauf dominiert. Große Werte werden mit einemkabgekürzt (zum Beispiel+1,2k). - Status —
OK, wenn Preis und Flow übereinstimmen, oder ein Pfeil plus eine Dauer, wenn der Zeitrahmen divergiert:↗ 2m 15sfür eine BULL-Divergenz,↘ 45sfür eine BEAR-Divergenz. Die gesamte Zeile wird schwach grün (BULL) oder schwach rot (BEAR) eingefärbt, solange eine Divergenz aktiv ist.
Druckmessgerät
Eine alternative (oder zusätzliche) Ansicht, die jede Zeitrahmen-Zeile in ein links/rechts Balkendiagramm des Kauf-/Verkaufsdrucks verwandelt. Von einer dünnen Mittellinie aus beleuchtet Verkaufsdruck Zellen nach links und Kaufdruck Zellen nach rechts. Wie viele Zellen beleuchtet werden, spiegelt wider, wie stark dieser Zeitrahmen im Vergleich zu seinem eigenen jüngsten Normalzustand belastet ist, sodass ein schneller und ein langsamer Zeitrahmen jeweils gegen ihre eigene Basislinie und nicht gegeneinander dargestellt werden. Die beleuchteten Zellen hellen auf, wenn dieser Zeitrahmen sich in einer echten BULL- oder BEAR-Divergenz befindet. Ein Titel "PRESSURE METER" und eine eigene Urteilslinie befinden sich darunter.
Im beiden Layout erscheinen das Messgerät und die Lesetabelle nebeneinander und teilen sich eine einzige Urteilslinie.
Kerzenfärbung (das Regime)
Optional färbt der Indikator Ihre Preiskerzen nach der vorherrschenden Richtung — dem Regime —, was eine stabilere Lesung als jeder einzelne Zeitrahmen ist. Es kann Bull, Bear oder Konflikt sein und wird mit eingebauter Haftung gehalten, sodass es über Kerzen hinweg bestehen bleibt und sich nur ändert, wenn sich die Neigung deutlich verschiebt (dies vermeidet ständiges Hin- und Herwechseln).
Woraus das Regime aufgebaut ist. Jeder aktivierte Zeitrahmen "stimmt" für jede Kerze basierend auf seiner Preisrichtung ab, und die Stimmen werden zu einer laufenden Zahl kombiniert. Langsamere Zeitrahmen und größere Bewegungen zählen mehr. Diese kombinierte Zahl wird dann über die jüngsten Kerzen geglättet. Das geglättete Ergebnis ist das Einzige, das sowohl die Kerzenfarbe als auch das Histogramm in §6 steuert, sodass beide nie widersprüchlich sind.
Die Histogramme
Die gleiche geglättete Stimme, die die Kerzen färbt, wird auch als Histogramm im eigenen Bereich des Indikators unter dem Preis gezeichnet: grüne Balken über der Mitte, wenn die Netto-Neigung bullisch ist, rote Balken darunter, wenn bärisch, ein Balken pro geschlossener Kerze (die aktuelle Kerze aktualisiert sich live). Höhere Balken bedeuten eine stärkere Neigung. Da es dieselbe Zahl hinter der Kerzenfärbung ist, stimmen Histogramm und Kerzenfarben immer überein. Es ist nützlich, um Momentum-Verlust zu erkennen — zum Beispiel wenn der Preis ein neues Hoch erreicht, während die Spitzen des Histogramms kürzer werden.
Referenzlinien
Optional zeichnet der Indikator flache horizontale Referenzlinien, die die Spitzen und Tiefen des Histogramms auf beiden Bereichen gleichzeitig hervorheben: Die Linie im Unterbereich liegt am Extrem des Histogramms, und eine passende Linie im Preis-Chart liegt am Hoch (für ein Aufwärts-Extrem) oder Tief (für ein Abwärts-Extrem) derselben Kerze. Die gleiche Referenz auf beiden Bereichen macht Divergenzen deutlich sichtbar — zum Beispiel wenn der Preis ein neues Hoch druckt, während die passende Linie des Histogramms zeigt, dass dies nicht gelungen ist.
Soundalarme
Der Indikator kann Ihnen akustische Hinweise geben, sodass Sie das Panel nicht ständig beobachten müssen. Es gibt zwei unabhängige Alarmquellen, die beide nur funktionieren, wenn das Panel das Druckmessgerät anzeigt (entweder im Messgerät-allein- oder im Nebeneinander-Layout) — die Alarme basieren auf der Messwertanzeige. Jede Quelle hat auch eine eigene Ein-/Aus-Taste, und eine gemeinsame Abkühlzeit verhindert, dass ein hektischer Markt die Sounds spamt.
Laden & Konsistenz
Mit Preload History aktiviert, baut der Indikator beim Laden die jüngste Historie wieder auf — die Kerzenfärbung, das Histogramm, Marker und Referenzlinien erscheinen sofort, anstatt sich erst nach und nach zu bilden. Max History Bars legt fest, wie weit diese Rekonstruktion zurückreicht (weiter zurück gibt mehr Kontext, lädt aber langsamer).
Die rekonstruierte Historie ist so aufgebaut, dass sie dem entspricht, was eine Live-Sitzung erzeugt hätte.
Wie die Teile zusammenpassen
- Die Flow-Schätzung und die Zeitrahmen sind die Grundlage — alles andere liest von ihnen ab.
- Die Lesetabelle, das Druckmessgerät und die Urteilslinie zeigen den Zustand jedes Zeitrahmens und das einzelne kombinierte Urteil.
- Kerzenfärbung und Histogramm teilen sich eine geglättete Richtungslesung, sodass sie immer übereinstimmen.
- Marker werden ausgelöst, wenn sich diese Richtung ändert, beim Kerzenschluss.
- Referenzlinien markieren die Spitzen und Tiefen des Histogramms in beiden Bereichen.
- Soundalarme geben dem Druckmessgerät und dem kombinierten Urteil eine Stimme, sodass Sie vom Bildschirm weggehen können.
Zusammenfassung
The indicator features a draggable on-chart panel displaying a readings table per timeframe, a combined verdict line, and an optional buy/sell pressure meter. It offers bar coloring that tints price candles by prevailing directional regime (Bull, Bear, or Conflict), a histogram reflecting smoothed directional votes, markers indicating direction changes, and optional reference levels highlighting histogram extremes to aid divergence detection. Sound alerts provide audio cues based on pressure meter readings.
The indicator preloads recent history to present immediate, consistent data upon loading. It supports visualization, signals for divergences, breakouts, reversals, trend strength, volatility regimes, and level touches or breaks, requiring tick data input.





![„Smart Money Concepts (SMC) [Iridio Capital]“-Logo](https://cdn.ctrader.com/image/webp/b4b5414d-a5ca-44b7-a947-e28eca44a218_61548)