
Descripción
Etiqueta de Momentum de Amplitud — Detección Adaptativa de Tendencias Impulsada por la Volatilidad
El Etiquetador de Momentum de Amplitud unifica múltiples conceptos avanzados:
- Detección de Régimen — Identifica fases verdaderas de tendencia
- Adaptación a la Volatilidad — Se ajusta automáticamente a las condiciones actuales del mercado
- VWAP Dinámico — Destaca niveles significativos de retroceso y continuación
- Estimador de Spread Roll — Señala puntos óptimos de reentrada durante las tendencias
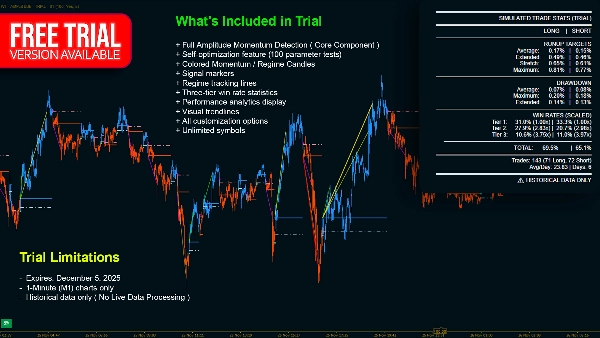
- MÓDULO DE OPTIMIZACIÓN — con función de auto-optimización**
Esto crea un indicador inteligente y autoajustable que ofrece claridad, adaptabilidad y zonas de operación accionables—sin ajustes manuales constantes.
¿Qué es?
El Etiquetador de Momentum de Amplitud es un indicador de detección de régimen que identifica cuándo el mercado entra o sale de fases de momentum alcista o bajista—en tiempo real.
A diferencia de los cruces tradicionales de medias móviles, mide cambios reales de momentum evaluando el desplazamiento del precio y la fuerza de reversión.
La Pregunta Central
¿Está el mercado actualmente en una fase de momentum—y en qué dirección?
Para responder esto, el indicador rastrea:
- Amplitud — qué tan lejos se ha movido el precio;
- Secuencia — el orden en que ocurren los máximos y mínimos.
Un movimiento fuerte seguido de una reversión significativa marca el comienzo de un nuevo régimen de momentum.
Cómo Funciona
1. Medir el Swing
El indicador actualiza constantemente los extremos de precio más altos y más bajos.
Su diferencia—amplitud—define el tamaño actual del swing del mercado.
2. Detectar Reversión
- Una caída brusca seguida de un fuerte repunte → **Momentum alcista**
- Un aumento brusco seguido de una fuerte caída → **Momentum bajista**
3. Confirmar Significancia
Solo las reversiones que superan un umbral ajustado por volatilidad activan una señal válida.
4. Detectar Agotamiento
Si el precio deja de avanzar, el indicador identifica agotamiento del momentum y vuelve a neutral.
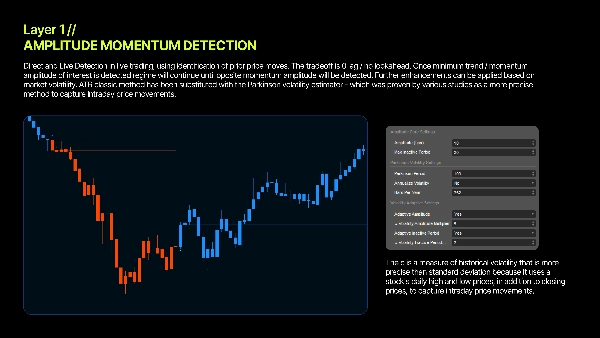
Volatilidad Parkinson — Umbrales Adaptativos
La mayoría de los indicadores usan parámetros fijos. Este se adapta automáticamente. Usando Volatilidad Parkinson—que incorpora rangos intradía de máximos y mínimos—el indicador ajusta la sensibilidad según las condiciones reales del mercado. El resultado: rendimiento consistente en entornos tranquilos y volátiles. ( Estadísticamente probado como más eficiente que el Método ATR )
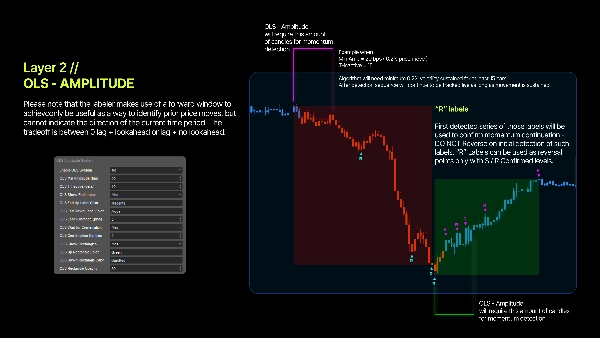
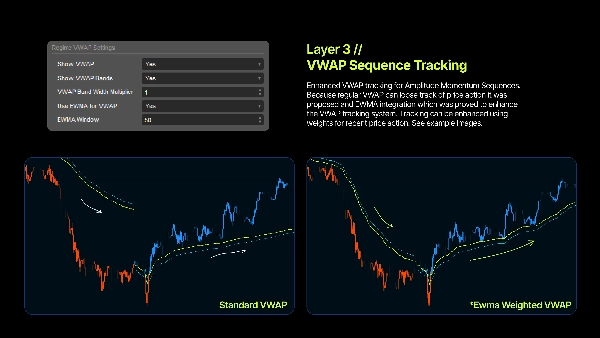
VWAP de Régimen — Niveles Dinámicos para Reentrada
Una vez que un régimen está activo, el indicador calcula un VWAP específico para esa tendencia, proporcionando Niveles Dinámicos de Soporte y Resistencia Dinámica. Las instituciones dependen mucho del VWAP, y el precio a menudo reacciona alrededor de él—lo que lo hace ideal para entradas en retroceso.
Modo EWMA
Active EWMA para ponderar más los precios recientes, creando una curva VWAP más suave y sensible. Excelente para identificar reentradas durante tendencias extendidas.
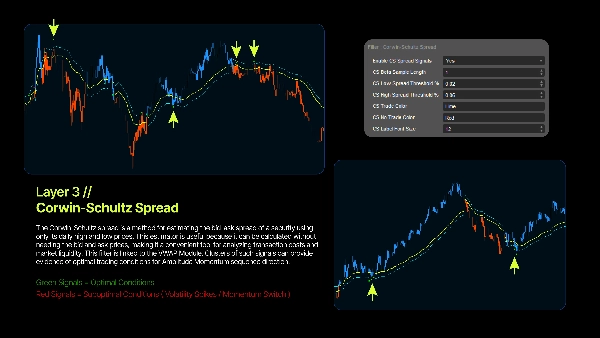
Estimador de Spread Roll - Filtro Dinámico para Reentrada
Un estimador de spread roll es un método para estimar el spread bid-ask a partir de precios de operaciones observados, típicamente usando la covarianza serial de los cambios de precio. Desarrollado por Roll, asume que las operaciones sucesivas alternan entre los precios de oferta y demanda, y que la nueva información no mueve constantemente el precio "verdadero". Aunque simple y fundamental, el método original ha sido refinado para abordar problemas como el sesgo a la baja y el bajo rendimiento en ciertos conjuntos de datos. El estimador se basa en la idea de que si no se libera nueva información, los precios simplemente rebotarán entre la oferta y la demanda. Asume una probabilidad igual de una operación iniciada por compra y una iniciada por venta.
Beneficios de Uso
1. Identificación Objetiva de Tendencias - Sin líneas de tendencia. Sin conjeturas. Las matemáticas definen el régimen.
2. Adaptativo a la Volatilidad - Se ajusta automáticamente a condiciones cambiantes usando Volatilidad Parkinson.
3. Zonas Claras de Entrada - Los niveles VWAP de régimen ayudan a identificar áreas intuitivas de retroceso y añadidos.
4. Límites Definidos del Régimen - Saber exactamente cuándo comienza y termina el momentum.
5. Compatibilidad Multi-Timeframe - La normalización en puntos básicos asegura un comportamiento consistente en cualquier gráfico.
La Base Cuantitativa
Retornos Logarítmicos
Usar retornos logarítmicos asegura simetría, haciendo que la medición del momentum sea matemáticamente robusta.
Puntos Básicos
Todos los cálculos usan unidades estandarizadas de bps (1 bps = 0.01%), permitiendo consistencia entre activos.
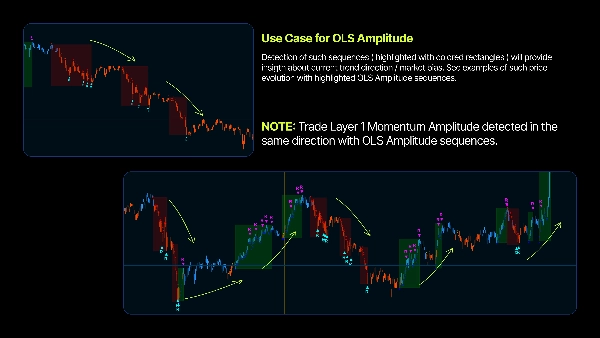
Detección de Retrocesos
Los cambios de momentum se identifican mediante movimientos direccionales fuertes seguidos de contra-movimientos significativos (reversiones en forma de V).
Volumen Sintético
El volumen sintético basado en rango y cuerpo asegura la precisión del VWAP para cualquier símbolo.
⎽⎽⎽⎽⎽⎽⎽⎽⎽⎽⎽⎽⎽⎽⎽⎽⎽⎽⎽⎽⎽⎽⎽⎽⎽⎽⎽⎽⎽⎽⎽⎽⎽⎽⎽⎽⎽⎽⎽⎽⎽⎽⎽⎽⎽⎽⎽⎽⎽⎽⎽⎽⎽⎽⎽⎽⎽⎽⎽⎽⎽⎽⎽⎽⎽⎽⎽⎽⎽⎽⎽⎽⎽⎽⎽⎽⎽⎽⎽⎽⎽⎽⎽⎽⎽⎽⎽⎽⎽⎽⎽⎽⎽⎽⎽⎽⎽⎽⎽⎽⎽⎽⎽⎽⎽⎽⎽⎽⎽⎽⎽⎽
Esta herramienta es solo para fines educativos e informativos. No es un consejo de inversión. Operar implica riesgos, y las pérdidas pueden exceder los depósitos. El rendimiento pasado no garantiza resultados futuros. Usted es el único responsable de todas las decisiones de trading. El creador no se hace responsable de pérdidas financieras derivadas del uso del indicador. Siempre realice su propio análisis antes de operar.
Resumen
Key features include:
- **Regime Detection:** Pinpoints market entry and exit points for momentum trends.
- **Volatility Adaptation:** Uses Parkinson Volatility to self-tune sensitivity based on current market conditions, ensuring consistent performance across varying volatility.
- **Dynamic VWAP:** Calculates a volume-weighted average price specific to each trend regime, providing dynamic support and resistance levels for pullback and continuation entries.
- **Roll Spread Estimator:** Estimates bid-ask spreads to signal optimal re-entry points during trends.
- **Self-Optimization Module:** Automatically adjusts parameters without manual intervention.
The indicator operates by continuously tracking price extremes to measure swing amplitude, detecting significant reversals that exceed volatility-adjusted thresholds, and identifying momentum exhaustion when price progression stalls. It uses logarithmic returns and basis-point normalization for mathematically robust, cross-asset consistency. Synthetic volume calculations enhance VWAP accuracy across symbols.
This tool supports multiple markets including Forex, stocks, indices, commodities, and cryptocurrencies, and is compatible with various timeframes. It outputs visual signals and filters to assist traders in objective trend identification and clear entry zone determination.
Valoraciones de clientes
5 | 75 % | |
4 | 25 % | |
3 | 0 % | |
2 | 0 % | |
1 | 0 % |


