
설명
정량적 정성 평가(QQE) 다중 타임프레임 지표
이 정량적 정성 평가(QQE) 지표는 평활 이동평균을 통합하여 상대 강도 지수(RSI)를 향상시키는 기술적 분석 도구입니다. 이는 거래자들이 추세 강도, 잠재적 반전 및 과매수/과매도 상태를 보다 정확하게 평가하는 데 도움을 줍니다.
QQE는 두 가지 주요 구성 요소를 특징으로 합니다: 빠른 및 느린 추적 정지 수준으로, 이는 동적인 지지선과 저항선 역할을 합니다. 이로 인해 추세 추종 및 평균 회귀 전략 모두에 적합한 다목적 도구가 됩니다. QQE 선과 신호선 간의 교차은 종종 잠재적인 매수 또는 매도 기회를 나타냅니다.
다중 타임프레임 QQE: 고급 버전
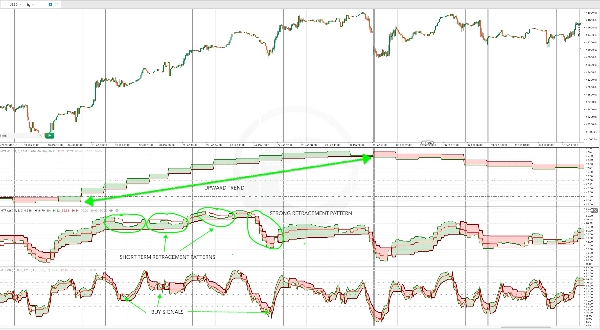
이 향상된 QQE 지표 버전은 다중 타임프레임 도구로 설계되어, 빠른 및 느린 추세선을 통합하여 정밀도를 높였습니다. 여러 타임프레임에서 가격 움직임을 분석함으로써 시장 추세에 대한 포괄적인 시각을 제공합니다.
그의 고급 평활 알고리즘은 신뢰성을 높여, 다음과 같은 독립적인 효과적인 지표로 만듭니다:
✅ 추세 방향 식별
✅ 정확한 진입 및 청산 신호 생성
✅ 과매수 및 과매도 상태 감지
다중 타임프레임 QQE의 유연성은 추세 추종 및 반전 전략 모두에 적합합니다.
다중 타임프레임 QQE 사용 방법
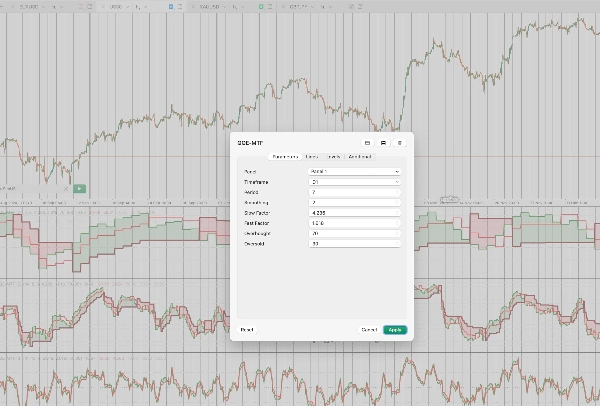
다중 타임프레임 QQE를 구성하려면 거래자는 다음을 선택해야 합니다:
🔹 타임프레임 (예: 일간, H4, H1)
🔹 기간 (계산에 사용되는 캔들 수)
🔹 평활 기간 (RSI 평활용)
🔹 느리고 빠른 요소 (민감도 조절용)
🔹 사용자 정의 가능한 과매수 및 과매도 수준
📌 참고: 이 지표는 다중 타임프레임 지표이므로, 차트에 추가한 후에는 cTrader 인터페이스에서 축소하여 충분한 데이터가 로드되고 지표가 제대로 초기화되도록 하는 것이 중요합니다.
다중 타임프레임 QQE를 활용한 거래 전략
1️⃣ 고타임프레임 추세 확인용 QQE
다중 타임프레임 QQE를 사용하는 효과적인 방법 중 하나는 상위 타임프레임에서 추세 확인을 하면서 하위 타임프레임에서 되돌림 진입을 식별하는 것입니다.
예를 들어:
- 일간 타임프레임에서 QQE가 강한 추세를 확인하는 데 사용됩니다.
- 되돌림 진입은 스토캐스틱 오실레이터가 과매수 또는 과매도 수준을 교차할 때 식별됩니다.
이 방법은 거래자들이 전체 추세에 맞춰 진입할 수 있도록 도와줍니다.
2️⃣ 더 깊은 시장 통찰을 위한 다중 타임프레임 분석
여러 타임프레임에서 QQE를 사용하면 거래자들이 자산의 행동을 더 자세히 이해할 수 있습니다.
예를 들어, 다음 타임프레임에 QQE를 적용함으로써:
📊 일간 타임프레임(D1): 전체 추세 방향을 결정합니다.
📊 4시간 타임프레임(H4): 추세 방향을 확인하고 단기 되돌림을 식별합니다.
📊 1시간 타임프레임(H1): 과매수/과매도 상태 또는 역추세 움직임에 기반한 정확한 진입 신호를 생성합니다.
이 구조화된 접근법은 거래 타이밍과 의사결정을 향상시키며, 서로 다른 타임프레임 간 신호를 일치시킵니다.
요약
This advanced multi-timeframe tool integrates fast and slow trend lines to analyze price action across different timeframes, providing a comprehensive view of market trends. Its smoothing algorithm improves reliability, making it effective for identifying trend direction, generating precise entry and exit signals, and detecting overbought/oversold levels.
Users configure the indicator by selecting a timeframe (e.g., Daily, H4, H1), periods for calculation, smoothing period for RSI, sensitivity factors, and customizable overbought/oversold thresholds. It is recommended to zoom out in the cTrader interface after adding the indicator to allow sufficient data loading.
Typical strategies include using the QQE on higher timeframes for trend confirmation and on lower timeframes for entry timing, as well as multi-timeframe analysis to enhance trade timing and decision-making by aligning signals across timeframes.
고객 리뷰
5 | 50 % | |
4 | 50 % | |
3 | 0 % | |
2 | 0 % | |
1 | 0 % |


