
الوصف
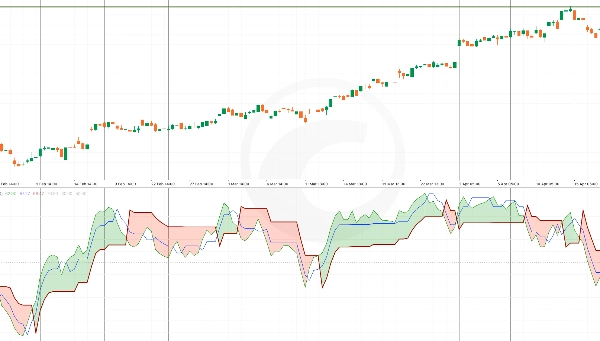
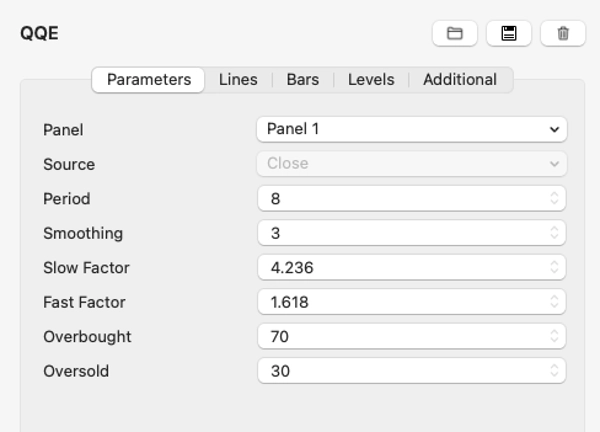
مؤشر التقدير الكمي النوعي (QQE) هو أداة تحليل فني تعزز مؤشر القوة النسبية (RSI) من خلال دمج المتوسطات المتحركة الملساء. يساعد المتداولين على تقييم قوة الاتجاه، الانعكاسات المحتملة، وحالات الشراء أو البيع المفرط بدقة أكبر.
يتميز QQE بمكونين رئيسيين: مستويات وقف الخسارة السريعة والبطيئة المتتبعة، التي تعمل كدعم ومقاومة ديناميكية. هذا يجعله أداة متعددة الاستخدامات لكل من استراتيجيات متابعة الاتجاه والاستراتيجيات القائمة على العودة إلى المتوسط. غالبًا ما يشير التقاطع بين خط QQE وخط الإشارة الخاص به إلى فرص محتملة للشراء أو البيع.
الملخص
ملخص الذكاء الاصطناعي
The Quantitative Qualitative Estimation (QQE) indicator is a technical analysis tool that enhances the Relative Strength Index (RSI) by integrating smoothed moving averages. It provides improved assessment of trend strength, potential reversals, and overbought or oversold market conditions. The indicator includes two main components: fast and slow trailing stop levels, which serve as dynamic support and resistance points. This design supports both trend-following and mean-reversion trading strategies. Additionally, crossovers between the QQE line and its signal line are used to identify potential buy or sell signals. The QQE indicator is applicable across various markets, including indices, and is categorized under momentum indicators.
ملف تعريف المؤشر
تقييمات العملاء
0.0
التقييمات: 0
تقييمات العملاء
لا توجد تقييمات لهذا المنتج حتى الآن. هل جرَّبته بالفعل؟ كن أول من يخبر الآخرين!
مناقشة
الأسئلة الشائعة
Signal
Indices
RSI
يتم توفير المنتجات المتاحة من خلال cTrader Store، بما في ذلك روبوتات التداول والمؤشرات والإضافات، من قبل مطوري الطرف الثالث وإتاحتها لأغراض الوصول المعلوماتي والفني فقط. cTrader Store ليس وسيطًا ولا يقدم نصائح استثمارية أو توصيات شخصية أو أي ضمان للأداء المستقبلي.


![شعار "[Stellar Strategies] Smart ADX"](https://cdn.ctrader.com/image/webp/af13b084-b6f6-41db-b7bc-c7e688b57b05_36929)


السعر
12
المبيعات
421
التثبيتات المجانية