
คำอธิบาย
MFI-MTF: ดัชนีการไหลของเงินหลายกรอบเวลา
ภาพรวม
MFI- MTF เป็นตัวชี้วัดโมเมนตัมหลายกรอบเวลาที่นำมุมมองกรอบเวลาที่สูงกว่ามาสู่กราฟปัจจุบันของคุณ โดยการคำนวณดัชนีการไหลของเงิน (MFI) บนกรอบเวลาที่ใหญ่กว่าและแสดงบนกราฟที่คุณกำลังใช้งาน ตัวชี้วัดนี้ช่วยให้คุณระบุสภาวะซื้อเกินและขายเกินในหลายมุมมองของตลาดโดยไม่ต้องสลับกรอบเวลาเอง
สิ่งที่มันทำ
การวิเคราะห์ดัชนีการไหลของเงิน: ตัวชี้วัดวัดแรงกดดันในการซื้อและขายโดยวิเคราะห์ทั้งการเคลื่อนไหวของราคาและปริมาณการซื้อขาย มันแกว่งตัวระหว่าง 0 ถึง 100 เพื่อระบุว่าเมื่อใดสินทรัพย์มีแรงกดดันซื้อ (ซื้อเกิน) หรือขาย (ขายเกิน) มากเกินไป
บริบทกรอบเวลาที่สูงกว่า: แทนที่จะคำนวณ MFI บนกรอบเวลาปัจจุบันของกราฟของคุณ MFIMTF ดึงข้อมูลจากกรอบเวลาที่ใหญ่กว่าที่คุณระบุ (รายวัน รายสัปดาห์ 4 ชั่วโมง ฯลฯ) ซึ่งให้ข้อมูลเชิงลึกโมเมนตัมระดับสถาบันโดยไม่มีเสียงรบกวนจากกรอบเวลาที่ต่ำกว่า เมื่อ MFI รายวันแสดงสภาวะซื้อเกิน ตัวอย่างเช่น คุณจะรู้แนวโน้มใหญ่กำลังใกล้หมดแรง—ซึ่งเป็นบริบทที่มีค่าสำหรับการตัดสินใจเข้าและออก
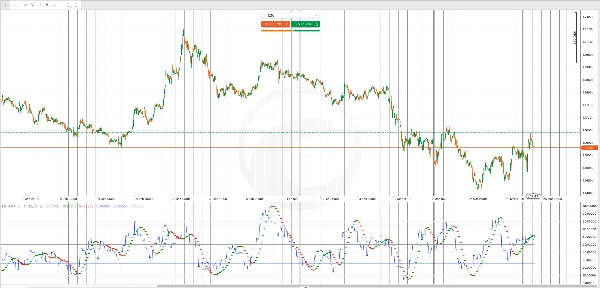
ตัวกรองค่าเฉลี่ยเคลื่อนที่ Hull: ค่าเฉลี่ยเคลื่อนที่ Hull (HMA) ที่นำมาใช้กับ MFI ช่วยลดความผันผวนและเน้นการเปลี่ยนแปลงทิศทางโมเมนตัม จุดสีเขียวแสดงถึงแนวโน้มโมเมนตัมขาขึ้น ในขณะที่จุดสีแดงแสดงถึงแนวโน้มขาลง ช่วยให้คุณยืนยันการเปลี่ยนแปลงทิศทางโมเมนตัมได้อย่างรวดเร็วด้วยภาพ
ผลลัพธ์หลัก
เส้น MFI (สีน้ำเงิน): ค่าดัชนีการไหลของเงินหลักจากกรอบเวลาที่สูงกว่าที่คุณเลือก แสดงบนแท่งเทียนทุกแท่งของกราฟปัจจุบัน
สัญญาณ HMA (จุดสีเขียว/แดง): จุดสีเขียวปรากฏเมื่อโมเมนตัมกำลังแข็งแกร่งขึ้นในทิศทางขาขึ้น; จุดสีแดงปรากฏเมื่อโมเมนตัมอ่อนแอลงหรือกลับตัวลง จุดเหล่านี้ทำหน้าที่เป็นสัญญาณเตือนล่วงหน้าสำหรับการเปลี่ยนแปลงที่อาจเกิดขึ้น
ระดับอ้างอิง:
- ระดับซื้อเกิน (ค่าเริ่มต้น 70): เมื่อ MFI เกินค่านี้ แรงกดดันซื้อจะมากเกินไปและมีแนวโน้มที่จะเกิดการกลับตัว
- ระดับขายเกิน (ค่าเริ่มต้น 30): เมื่อ MFI ต่ำกว่าค่านี้ แรงกดดันขายจะหมดลงและมีแนวโน้มที่จะเกิดการดีดตัว
- เส้นกลาง (50): จุดสมดุลกลางระหว่างโมเมนตัมขาขึ้นและขาลง
การปรับแต่ง
การเลือกกรอบเวลา: เลือกกรอบเวลาที่สูงกว่ากราฟปัจจุบันของคุณ (เช่น รายวันบนกราฟ 1 ชั่วโมง) กรอบเวลาที่ใหญ่กว่าจะให้บริบทแนวโน้มที่กว้างขึ้นแต่สัญญาณน้อยลง; ช่วงเวลาที่เล็กกว่าจะให้โอกาสการเทรดมากขึ้นแต่มีมุมมองเชิงกลยุทธ์น้อยกว่า
ช่วงเวลาของ MFI: ปรับช่วงเวลาย้อนหลังสำหรับดัชนีการไหลของเงิน (ค่าเริ่มต้น 14) ช่วงเวลาสั้นทำให้ตัวชี้วัดตอบสนองต่อการเปลี่ยนแปลงปริมาณล่าสุดได้ดีขึ้น; ช่วงเวลายาวช่วยลดความผันผวนและลดสัญญาณผิดพลาด
ช่วงเวลาของ HMA: ควบคุมการปรับค่าเฉลี่ยของตัวกรองโมเมนตัม ช่วงเวลาสั้นทำให้การเปลี่ยนแปลงแนวโน้มชัดเจนขึ้นแต่มีเสียงรบกวนมากขึ้น; ช่วงเวลายาวยืนยันแนวโน้มได้แม่นยำขึ้นแต่สัญญาณช้าลง
เกณฑ์ซื้อเกิน/ขายเกิน: ปรับแต่งระดับเหล่านี้ให้เหมาะกับสไตล์การเทรดของคุณ เทรดเดอร์ที่ระมัดระวังอาจใช้ 75/25; เทรดเดอร์ที่กล้าหาญอาจใช้ 80/20 เพื่อรอสภาวะที่รุนแรงมากขึ้น
การใช้งานจริง
ใช้ MFI MTF เพื่อเพิ่มความมั่นใจในการเข้าและออกของคุณ สัญญาณขายบนกรอบเวลาที่คุณใช้งานจะน่าเชื่อถือมากขึ้นหาก MFI รายวันอยู่ในสภาวะซื้อเกิน แสดงว่านักขายสถาบันน่าจะกำลังทำงานอยู่ ในทำนองเดียวกัน สัญญาณซื้อจะมีความแข็งแกร่งขึ้นเมื่อ MFI ของกรอบเวลาที่สูงกว่าขายเกิน แสดงว่าแรงกดดันขายได้หมดลงในระดับมหภาค
การเปลี่ยนสีของ HMA ให้การแจ้งเตือนแบบเรียลไทม์เกี่ยวกับการเปลี่ยนแปลงโมเมนตัม ช่วยให้คุณออกจากการเทรดที่ขาดทุนได้เร็วขึ้นหรือปรับลดขนาดตำแหน่งก่อนที่การกลับตัวจะรุนแรง
สรุป
The indicator includes a Hull Moving Average (HMA) filter applied to the MFI to smooth out noise and highlight momentum shifts. Green dots indicate strengthening upward momentum, while red dots signal weakening or downward momentum. Reference levels include default overbought (70), oversold (30), and a neutral midpoint (50), all customizable to fit different trading styles.
Key outputs are the MFI line from the chosen higher timeframe and HMA signals for momentum direction changes. Adjustable parameters include the MFI lookback period, HMA smoothing period, and overbought/oversold thresholds. MFI-MTF aids in confirming entry and exit points by providing institutional-level momentum insights and real-time alerts to momentum shifts on your working chart.
รีวิวจากลูกค้า
5 | 100 % | |
4 | 0 % | |
3 | 0 % | |
2 | 0 % | |
1 | 0 % |


